Join Our Telegram channel to stay up to date on breaking news coverage
Bitcoin (BTC) Price Prediction – September 24
Bitcoin (BTC) price is trading nicely above the $10,500 and the coin must climb above the $11,000 resistance to continue higher.
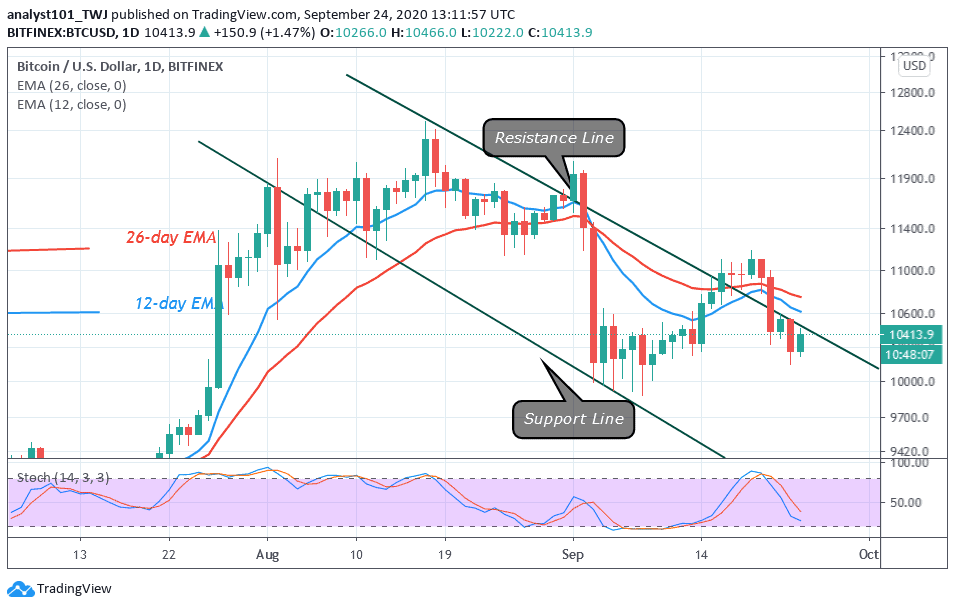
BTC/USD Long-term Trend: Ranging (Daily Chart)
Key levels:
Resistance Levels: $11,000, $11,200, $11,400
Support Levels: $9,600, $9,400, $9,200

BTC/USD starts trading with a downside movement as the coin touched $10,192 in the early hours of today, but later, BTC/USD market started improving, moving it out of the downside to the upside. However, within the first few days of this second month of the first quarter, BTC/USD has moved up from $10,192 to $10,737 and now changing hands at $10,636.
Will BTC Break Through $11,000 Resistance Level or Reverse?
BTC/USD is finding it difficult to climb higher above the $10,800 resistance as the coin is settling in a tight range around the 9-day and 21-day moving averages. Typically when the new uptrend movements are beginning to form, buyers may use the 21-day MA as the nearest support levels. But in as much as the orange-line of the 9-day MA is above the green-line of the 21-day MA, the market may likely follow the upward movement.
However, if the market decides resume downtrend, Bitcoin’s price may drop to $10,000, and should this support fails to contain the sell-off, we may see a further drop to $9,600, $9,400, and critically $9,200. The resistance levels to watch are $11,000, $11,200, and $11,400 respectively. Meanwhile, the technical indicator RSI (14) is facing the north, suggesting additional bullish signals into the market.
BTC/USD Medium – Term Trend: Bullish (4H Chart)
Looking at the 4-hour chart, Bitcoin’s price is currently trading around $10,675 and above the 9-day and 21-day moving averages after a reversal from the low of $10,192 in today’s trading. Meanwhile, traders can notice that the bullish supply is coming up slowly into the market.
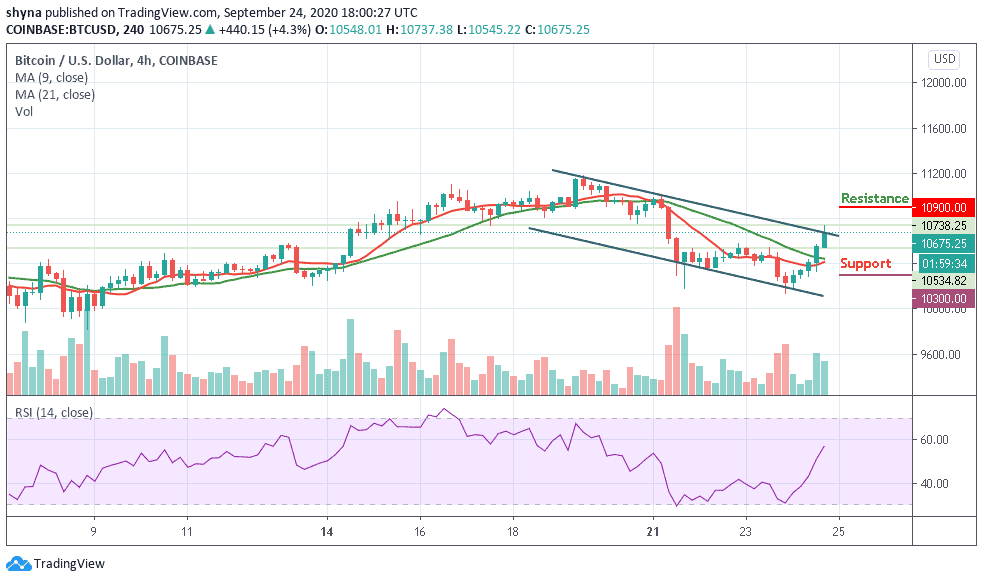
However, if the buyers continue to strengthen and energize the market, they may push the price towards the resistance level of $10,800. Therefore, breaking the mentioned resistance may allow the bulls to test the potential resistance at $10,900 and above. Meanwhile, the RSI (14) is making an attempt to cross above the 60-level, but any bearish movement below the moving averages could drag the coin to the support level of $10,300 and below.
Join Our Telegram channel to stay up to date on breaking news coverage