Join Our Telegram channel to stay up to date on breaking news coverage
Bitcoin (BTC) Price Prediction – September 13
The Bitcoin (BTC) needs to hold the current price region where it is now for the confirmation that it still remains in a bullish trend.
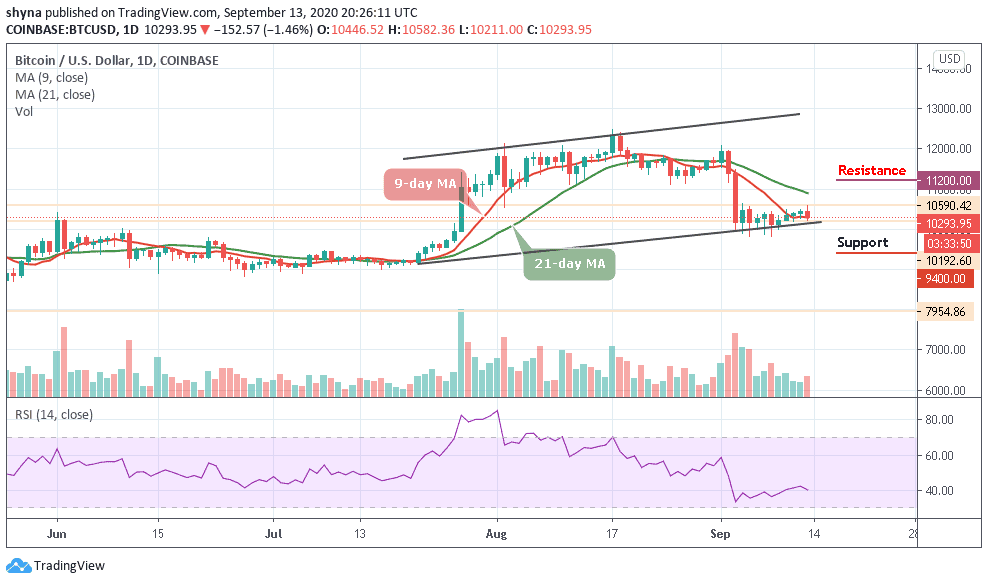
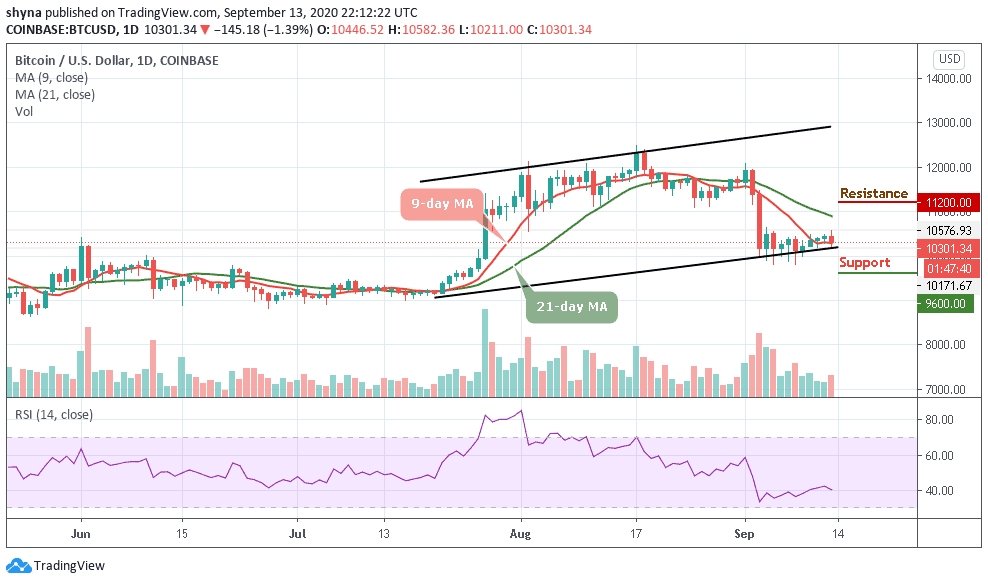
BTC/USD Long-term Trend: Ranging (Daily Chart)
Key levels:
Resistance Levels: $11,200, $11,000, $10,800
Support Levels: $9,600, $9,400, $9,200
Despite the fact that BTC/USD has been maintaining the upward movement since a few days ago, today, the first digital crypto is seen showing considerable weakness. More so, it is possible that the market price has begun the final wave down which could take it the coin to $9,700 support as the technical indicator RSI (14) is preparing to cross below the 40-level.
Where is BTC Price Going Next?
The daily range shows that the movement below the 9-day moving average could confirm a bear flag pattern, which means Bitcoin’s upward case would be jeopardized. Therefore, if the price remains above this barrier, it is essential that the bulls should seize the opportunity and quickly push that breakout to $11,000 which above the 21-day MA. Otherwise, another rejection at $10,800 could prematurely end the uptrend and bring the Bitcoin price towards the supports of $9,600, $9,400, and $9,200 respectively.
Nevertheless, BTC/USD is on the brick of a potentially massive breakout. If the bulls are to sustain the uptrend above $10,500, culminating in a flight above the moving averages, $11,000 could be a conservative target. Meanwhile, increased buying pressure may catapult the Bitcoin price to the resistance level of $11,200, $11,400, and $11,600. However, a move like this may renew the hope of seeing BTC/USD to trade above $12,000 again.
BTC/USD Medium – Term Trend: Bearish (4H Chart)
Looking at the 4-Hour chart, BTC/USD is seen on a downward move and the coin may continue to depreciate if the $10,200 support is broken. The coin is seen moving below the 9-day and 21-day moving averages. Breaking below the lower boundary of the channel may likely see BTC/USD reaching the critical supports at $10,000 and below.
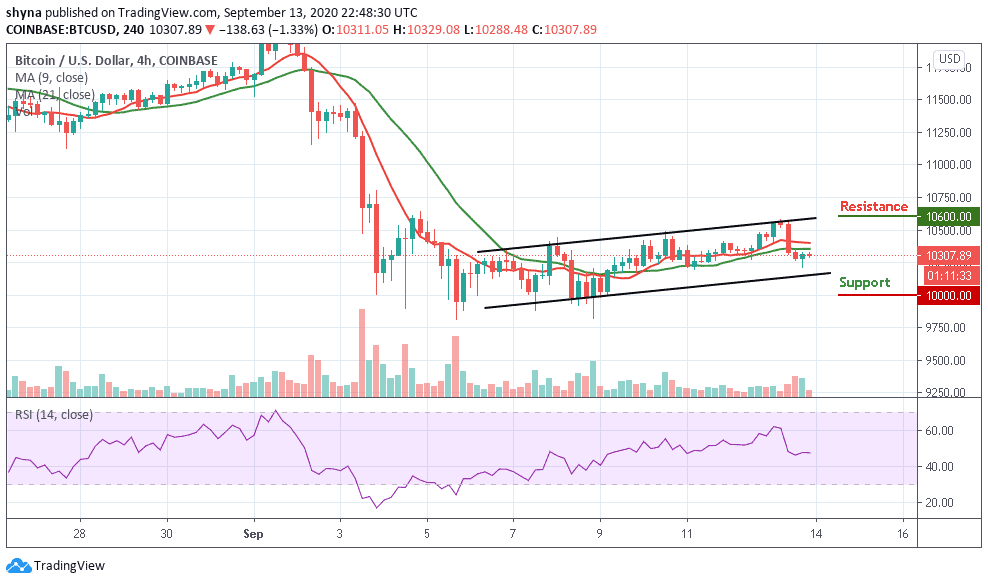
However, if the bulls can hold the current price tight, BTC/USD may likely cross above the moving averages to hit the potential resistance at $10,600 and above as the technical indicator, RSI (14) is seen moving around 47-level.
Join Our Telegram channel to stay up to date on breaking news coverage