Join Our Telegram channel to stay up to date on breaking news coverage
Bitcoin (BTC) Price Prediction – September 12
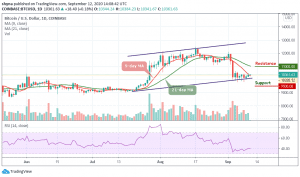
The Bitcoin price is showing stability above $10,000 as traders are waiting for the next big move.
BTC/USD Long-term Trend: Ranging (Daily Chart)
Key levels:
Resistance Levels: $11,000, $11,200, $11,400
Support Levels: $9,500, $9,300, $9,100

BTC/USD has been ranging between $9,800 and $10,500 for nearly a week after a short-fall from almost $12,100 seen on the first day of this month. As the coin struggles to show any distinctive price movement, traders are generally cautious. However, over the medium to long term, many traders expect BTC/USD to recover and perceive the on-going consolidation phase as a healthy pullback.
Where is BTC Price Going Next?
So far, the Bitcoin price successfully stays above the $10,000 mark. The first digital-asset continues to trade in the five-digit territory, trading above the 9-day moving average but still below the 21-day moving average. Recently, the coin even spiked above $10,400 during the early trading session as the technical indicator remains above the 40-level.
At the time of writing, it seems like BTC/USD might stay clear of the gap, with the cryptocurrency trading under its recent resistance level of $10,400. Meanwhile, from a technical perspective, the king-coin has to fight off the first resistance at $10,500 before having a chance to aim at $11,000, $11,200, and $11,400 resistance levels. On the contrary, any bearish movement below the lower boundary of the channel may likely lead to the critical supports at $9,500, $9,300, and $9,100.
BTC/USD Medium – Term Trend: Ranging (4H Chart)
There are several signs showing that BTC/USD is poised for a significant move to the upside. The price action of the past few days formed a symmetrical triangle on the 4-hour chart which appears to have broken out with a decent move towards $10,414. Additionally, the RSI (14) indicator is notably squeezing, indicating that high volatility may come into play.

The upper band coincides with the moving averages and a resistance level established on September 10 at $10,218. However, a move above the $10,400 area with a strong close above it may likely push the Bitcoin price up to the resistance level of $11,650 and above while the support levels are located at $10,000 and below.
Join Our Telegram channel to stay up to date on breaking news coverage