Join Our Telegram channel to stay up to date on breaking news coverage
Bitcoin (BTC) Price Prediction – September 10
Bitcoin (BTC) has been flashing some signs of strength since yesterday and this marks a notable rise from its recent lows that were set earlier this week.
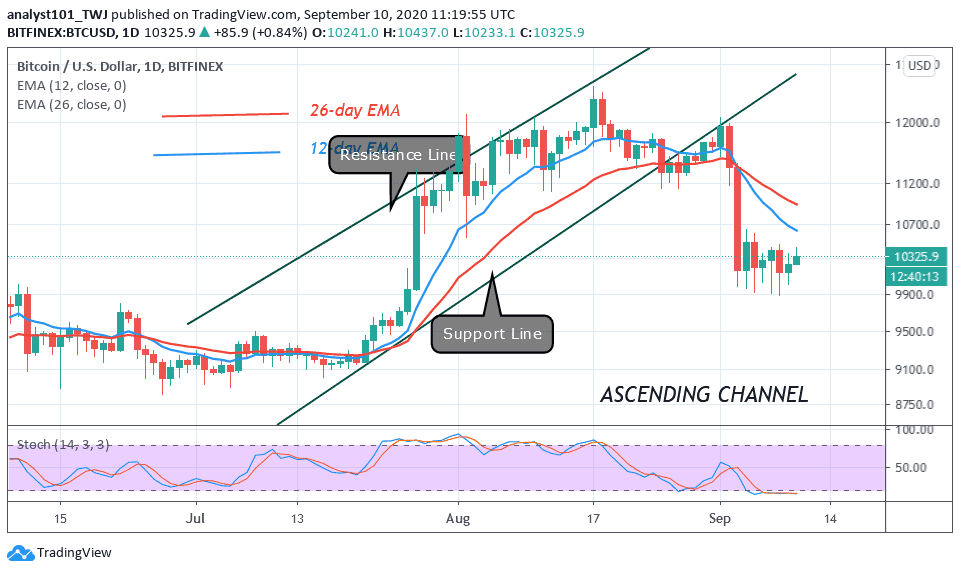
BTC/USD Long-term Trend: Ranging (Daily Chart)
Key levels:
Resistance Levels: $10,900, $11,100, $11,300
Support Levels: $9,700, $9,500, $9,300

BTC/USD is currently caught within a slight uptrend, as the first digital asset is pushing up towards $10,400 as sellers begin losing their edge over bulls. The upswing comes after multiple tests of its key support between $9,900 and $10,000. The strength of the buying pressure within this level should not be underestimated, as bears were unable to break it despite making several attempts to do so.
What is the Next for Bitcoin?
The strength in BTC’s high time frame market structure seems to indicate that a move up towards $11,000 could be imminent in the near-term. At the time of writing, BTC/USD is trading up at its current price of $10,295 which marks a notable rise from recent lows of $9,900 that were set and visited on multiple occasions throughout the past week. However, the bears did not have enough strength to shatter this price region as it appears that bulls now have the upper hand.
Nevertheless, if the market decides to fall, the price of Bitcoin could fall below the lower boundary of the channel at $10,000, and if that support fails to hold the sell-off, traders could see a further decline towards the support levels of $9,700, $9,500, and critically $9,300. All the same, any further bullish movement above the moving averages may hit the resistances at $10,900, $11,100, and $11,300 as the RSI (14) moves below 40-level.
BTC/USD Medium – Term Trend: Ranging (4H Chart)
According to the 4-hour chart, BTC/USD is trading within the range of $9,980 to $10,450. However, intraday trading is still looking bullish; at the beginning of today’s trading at $10,220 which is now a key support level. Meanwhile, the next key support levels are located at $10,000, $9,800, and $9,600.
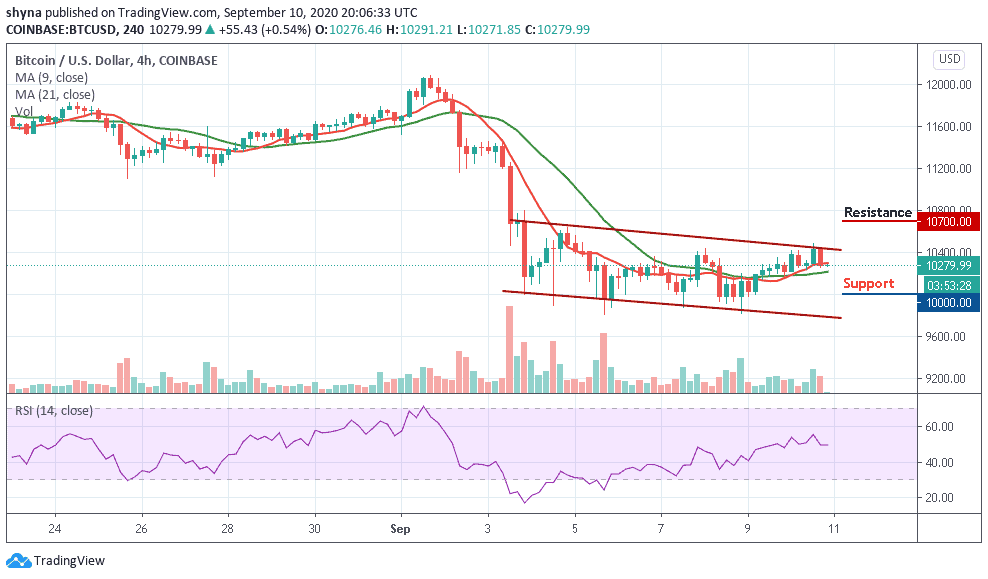
However, in as much as the buyers continue to reinforce and power the market more, traders can expect a retest at the $10,500 resistance level, and breaking this level may further push the price towards the resistance level of $10,000 and above. Similarly, the RSI (14) moves above 50-level to confirm the bullish movement.
Join Our Telegram channel to stay up to date on breaking news coverage