Join Our Telegram channel to stay up to date on breaking news coverage
Bitcoin (BTC) Price Prediction – September 10, 2020
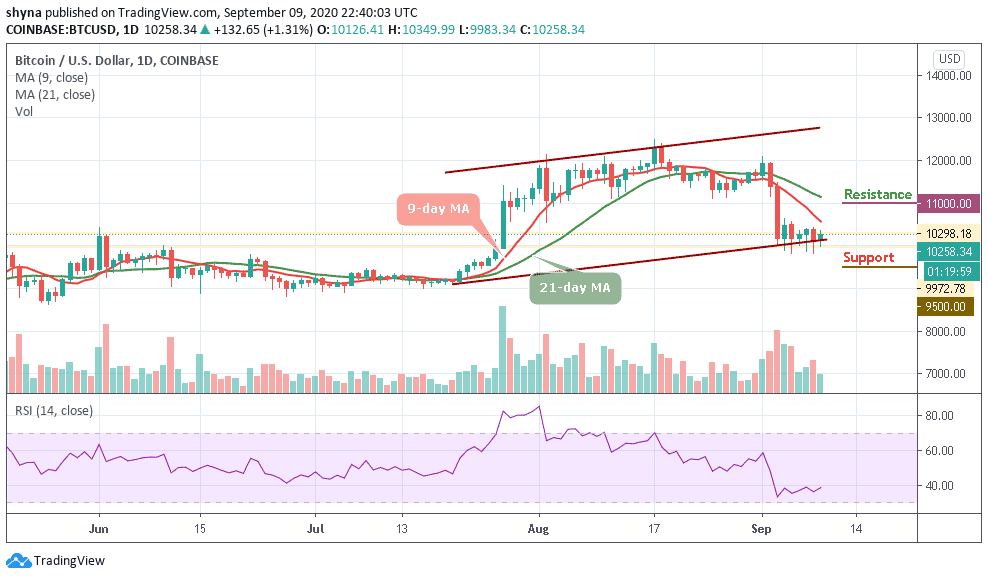
Today, BTC/USD reaches a high of $10,450 but faces rejection almost at the same time. For the past week, this has been the market scenario. Buyers and sellers have been on a price tussle between $10,000 and $10,500. The key levels of the market are yet to be broken convincingly as price consolidation continues. The king coin is trading at $10,310 at the time of writing.
Resistance Levels: $10,000, $11, 000, $12,000
Support Levels: $7,000, $6,000, $5,000
Bitcoin (BTC) has been fluctuating between $10,000 and $10,500. However, when the BTC price breaks above $10,500 or below $10,000, it faces rejection at both ends. This simply implies that BTC lacks buyers at the upper price level. When BTC breaks below, sellers attempt to push the market to the lower region. Buyers are more powerful as they buy the dips to push the coin upwards. For the past week, sellers have been able to push the coin to $9,800.
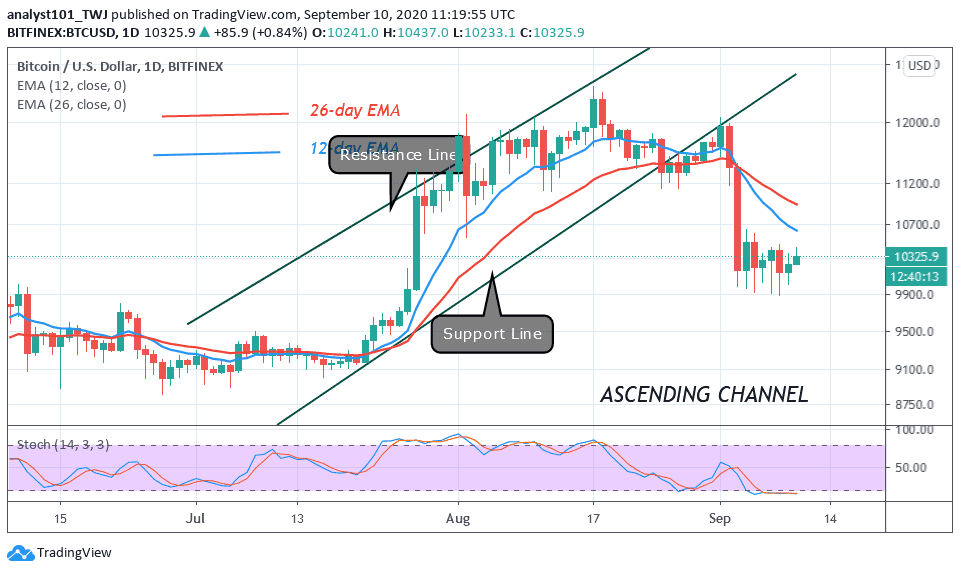
On the downside, if the bears succeed in breaking below the $9,800 support, BTC will fall to $9,300. The upside momentum will resume if price breaks above the $10,600 high. Nonetheless, the uptrend will resume, if the bulls can push BTC above $11,000. Meanwhile, the king coin is below the 20% range of the daily stochastic. The stochastic bands are horizontally flat indicating the sideways move. It also indicates that the king coin is in the oversold region as buyers are likely to emerge.
Correlation Between Bitcoin and Gold Reaches the Highest Level Since 2010
According to Bloomberg, the correlation between Bitcoin and Gold reaches its highest level in ten years. Analysts believe that there is a contradiction in Bloomberg’s assertion when compared with other data providers. It was discovered that Bloomberg calculates the metric differently from many other data providers. It states that the correlation stands at 0.8, the highest since 2010.
Bloomberg analyst and the author of the newsletter, Mike McGlone, further explains the firm’s Calculus: “Bloomberg default and simple % change function. The % monthly changes on a rolling 12-month basis, past 12-months, the highest in our database.” Analysts indicated that the major cause of the difference is that Bloomberg determines the correlation on monthly bases while they ought to have done it on a daily bases. McGlone also pointed out that the recent plunge of BTC price was caused by the Nasdaq’s dip. The argument is that if Gold sustains the price level above $1,900, Bitcoin should stay above $10,000 as well.
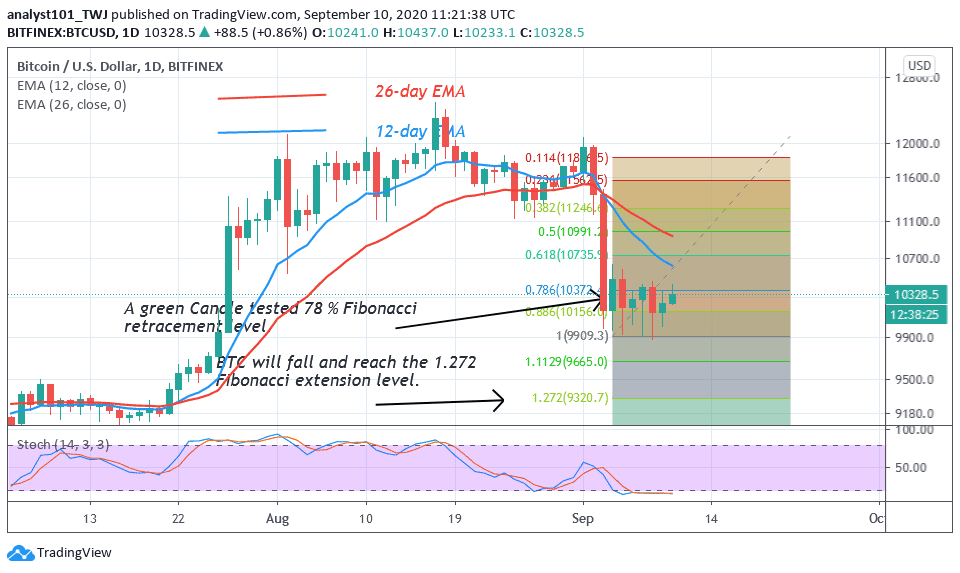
Today, Bitcoin is making an impressive move on the upside. The bottom line is that if price breaks above $10,600 and the momentum is sustained, it is assumed that the downtrend is over. On the other hand, the downtrend will continue if the support level is convincing broken. A drop to $9,300 is expected.
Join Our Telegram channel to stay up to date on breaking news coverage