

Join Our Telegram channel to stay up to date on breaking news coverage
Bitcoin (BTC) Price Prediction – January 8
After a minor downside correction, Bitcoin price begins a fresh increase above the $40,000 level as the king coin is seen surging over 4%.
BTC/USD Long-term Trend: Bullish (Daily Chart)
Key levels:
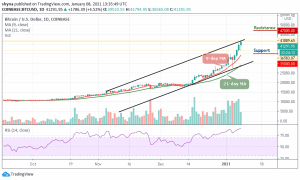
Resistance Levels: $47,000, $47,200, $47,400
Support Levels: $35,000, $34,800, $34,200
BTC/USD is creating a new all-time-high by breaching $41,000 early today after seeing a minor rejection at $40,000 yesterday. The Bitcoin price continues to trade above this month’s high. Its price is now around $41,291. However, the king coin is back trading in the upper $40,000 region and still remains in a positive zone with just over 4% gains.
Where is BTC Price Going Next?
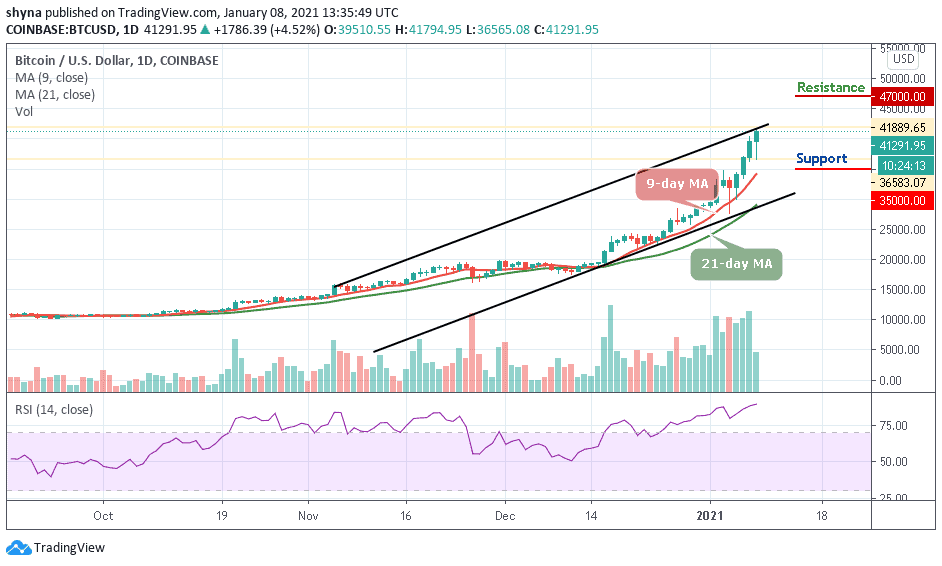
At the time of writing, BTC/USD is showing no signs of fatigue or any price crash fears despite rallying more than $21,000 in the past 21 days and it looks like the 2017 high of near $20,000 would just be a blip on the chart just like 2013 high. As the daily chart reveals, a decisive close above the $41,000 resistance level could open the doors for a fresh surge towards $42,000.
However, a strong bullish spike may take the price to $47,000, $47,500, and $47,700 resistance levels. Moreover, if the market makes a quick turn to the south, the Bitcoin price could drop below $38,000, and should this support fails to contain the sell-off; traders may see a further roll back to $35,000, $34,800, and critically $34,600. Nevertheless, the technical indicator RSI (14) suggests an upward movement for the coin as the signal line moves within the overbought region.
BTC/USD Medium – Term Trend: Bullish (4H Chart)
According to the 4-hour chart, the Bitcoin price surged upwards within 24 hours, catapulting its price to over $41,000 to reach the daily high at $41,986. This sudden rise also pushed the price overall other altcoins, which increased by more than 4.0% in the respective period. However, the closest resistance levels lie at $44,000 and $45,000, while the nearest supports are $38,000 and $36,000 respectively.
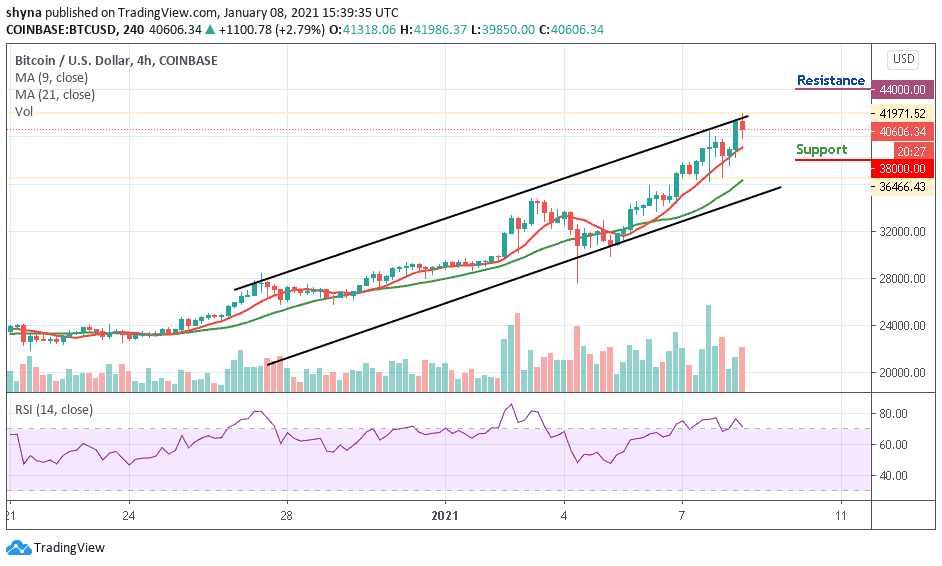
Moreover, as the coin moves above the 9-day and 21-day moving averages, the technical indicator is looking bullish but now flashing sell signals. The RSI (14) indicator is moving below the 70-level, which indicates a bearish movement at the moment.
Join Our Telegram channel to stay up to date on breaking news coverage
