Join Our Telegram channel to stay up to date on breaking news coverage
Bitcoin (BTC) Price Prediction – January 4
The Bitcoin price drops today from a high of $33,600 to a low of $27,678 within a few hours.
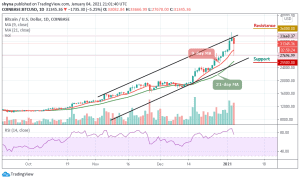
BTC/USD Long-term Trend: Bullish (Daily Chart)
Key levels:
Resistance Levels: $36,000, $36,200, $36,400
Support Levels: $25,500, $25,300, $25,100

BTC/USD is in the middle of a retracement move since the beginning of today’s trading. Meanwhile, the downward momentum has become quite unstoppable while the key support at $28,000 has been ravaged, forcing the bulls to concentrate on defending the next support which is targeted at $27,000. If this is broken, additional supports may be found at $25,500, $25,300, and $25,100.
What to Expect from Bitcoin (BTC)
The formation of a bullish flag pattern suggests that the upside action could continue only if the pattern’s support is not broken. However, a breakdown below the flags support may result in dire effects of Bitcoin price spiraling towards $26,000. The technical indicator has also supported the bearish motion, further drumming home the idea that this could be the end of bull’s rally.
However, the RSI (14) is seen moving below the 80-level within the overbought zone as the sharp downward slope is a clear indication of the influence which allows the bears to put more pressure into the market. Meanwhile, a reversal is possible but only if the resistance at $32,500 is reclaimed. The persistence trade above this level may technically push the coin to the resistance levels of $36,000, $36,200, and $36,400.
BTC/USD Medium – Term Trend: Bullish (4H Chart)
Looking at the 4-Hour chart, Bitcoin (BTC) has not yet slipped below $25,000 and is still in the loop of making a bounce back. The Bitcoin price hovers below the 9-day and 21-day moving averages and may likely take time to trade above the $34,000. At the moment, the Bitcoin price is currently moving around $31,484 level.
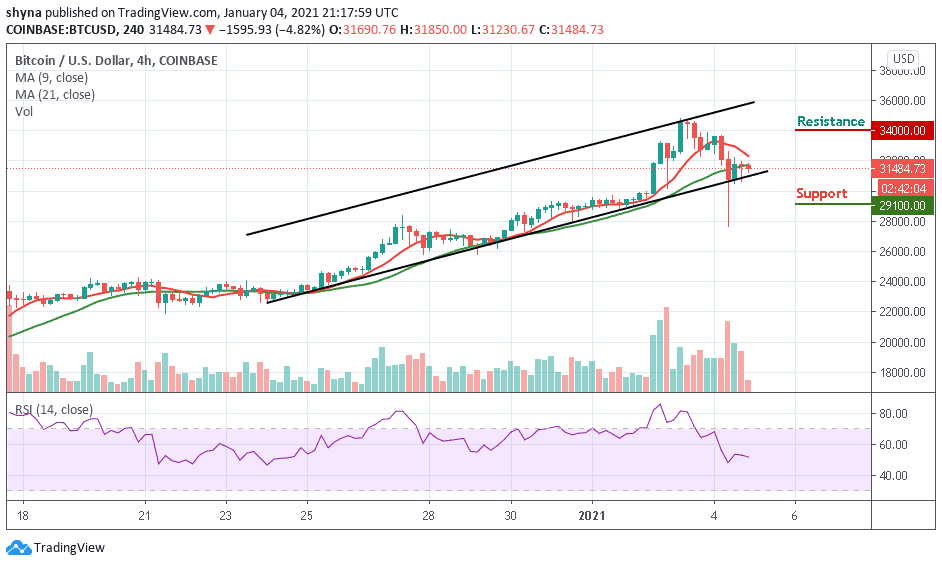
However, if the bulls can re-group and energize the market, traders may expect a retest of $25,000 level. Therefore, breaking the $33,000 could also allow the bulls to move above the 9-day and 21-day moving averages to test the resistance levels of $34,000 and above. In other words, if the bears should continue to hold the price and drag it downward, then the support levels of $29,100 and below may be visited as the RSI (14) moves below 550-level, indicating additional bearish movement.
Read more:
- Shiba Inu Price Retraces, Rejected at Resistance Level
- Bitcoin Price Prediction: BTC/USD Consolidates Above $7,300, a Rally Above $8,000 Is Expected
Join Our Telegram channel to stay up to date on breaking news coverage