Join Our Telegram channel to stay up to date on breaking news coverage
Bitcoin (BTC) Price Prediction – December 30
The Bitcoin (BTC) breaks the crucial resistance levels between $26,000 – 27,000 to continue its rally towards a new all-time high.
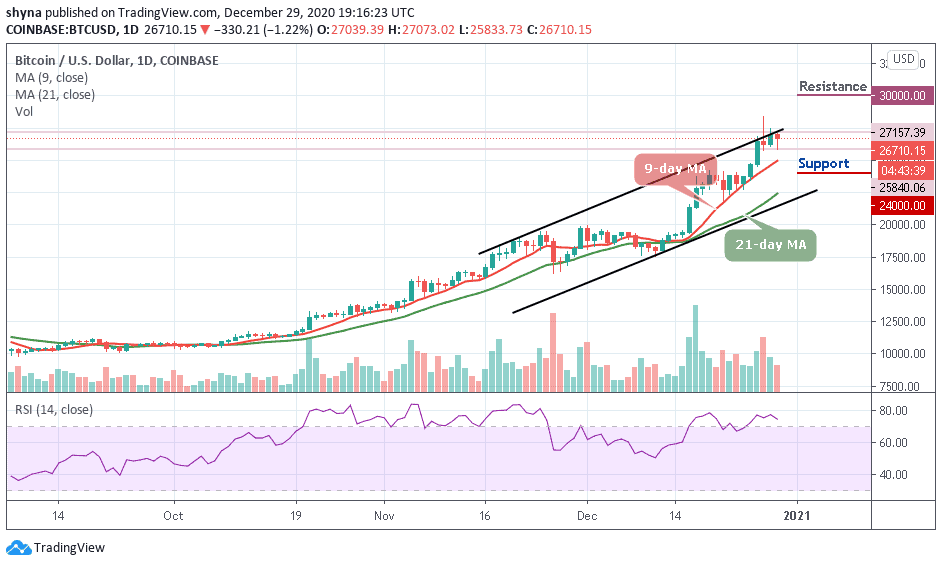
BTC/USD Long-term Trend: Bullish (Daily Chart)
Key levels:
Resistance Levels: $30,000, $30,200, $30,400
Support Levels: $25,600, $25,400, $25,200
Since the recent price increase, BTC/USD is following a bullish flag pattern; trading above the 9-day and 21-day moving averages. In the last few days of trading, Bitcoin appeared squeeze with an in-volatile market; signaling a possible price surge. The daily technical indicator RSI (14) is currently moving within the overbought region confirming the bullish movement in the market.
What to Expect from Bitcoin (BTC)
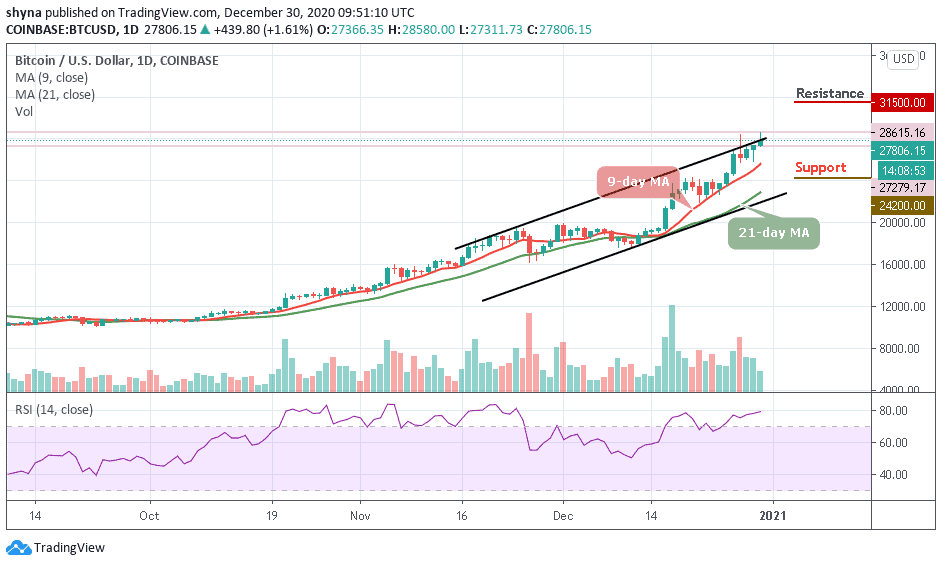
A strong buying sentiment persisted across the cryptocurrency market as BTC/USD reached another all-time high today. The first digital asset added more than $439.80, or over 1.61%, to touch the daily high at $28,580. However, if the $26,000 level sustains the support, bullish continuation is likely towards $30,000 and may even touch the resistance level of $32,500. On the other hand, if the market price goes below $26,000 support, then correction is imminent.
Looking ahead, if the sellers drive lower, the first level of support lies at $25,800. This is followed by the critical supports at $24,200, $24,000, and $23,800. On the other side, the first level of resistance lies at $29,000. Above this, potential resistance is expected at $31,500, $31,700, and $31,900 respectively. The RSI (14) is in extremely overbought territory which shows the buyers might be a little overextended.
BTC/USD Medium – Term Trend: Bullish (4H Chart)
Bitcoin price surged upwards within few hours of the opening trade, catapulting its price from $27,366 to touch the high of $28,566. This sudden rise also pushed the price overall other altcoins, which increased by more than 1.65% in the respective period. However, the closest resistance levels lie at $30,000 and $30,200, while the nearest supports are $25,600 and $25,400 respectively.
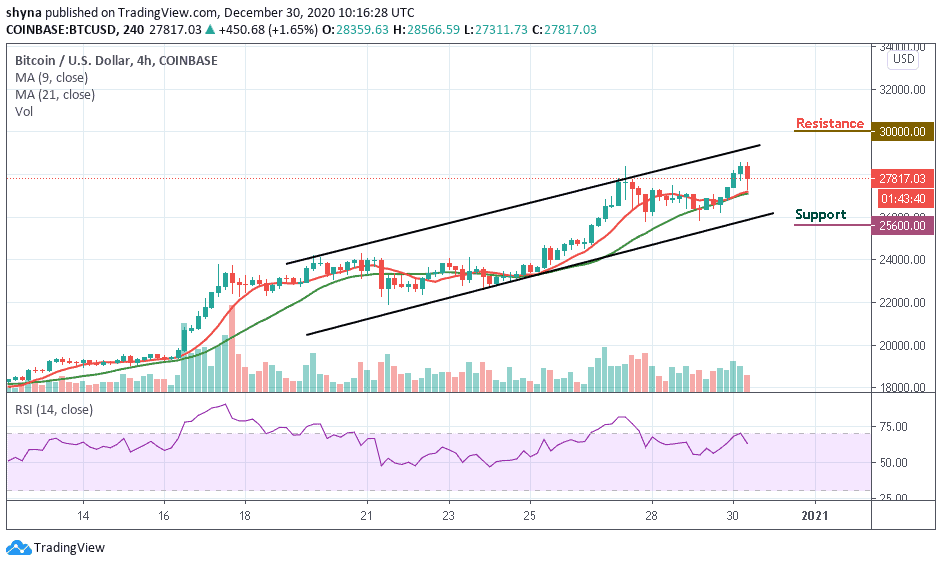
Presently, the coin is retreating towards the 9-day and 21-day moving averages, the technical indicator RSI (14) is also facing down flashing sell signal. After recording its lowest at $27,311, the buyers may need to gather momentum in order to push high again.
Join Our Telegram channel to stay up to date on breaking news coverage