Join Our Telegram channel to stay up to date on breaking news coverage
Bitcoin (BTC) Price Prediction – December 13
Bitcoin bulls are working hard to nurture a bullish trend from the support at $18,500.
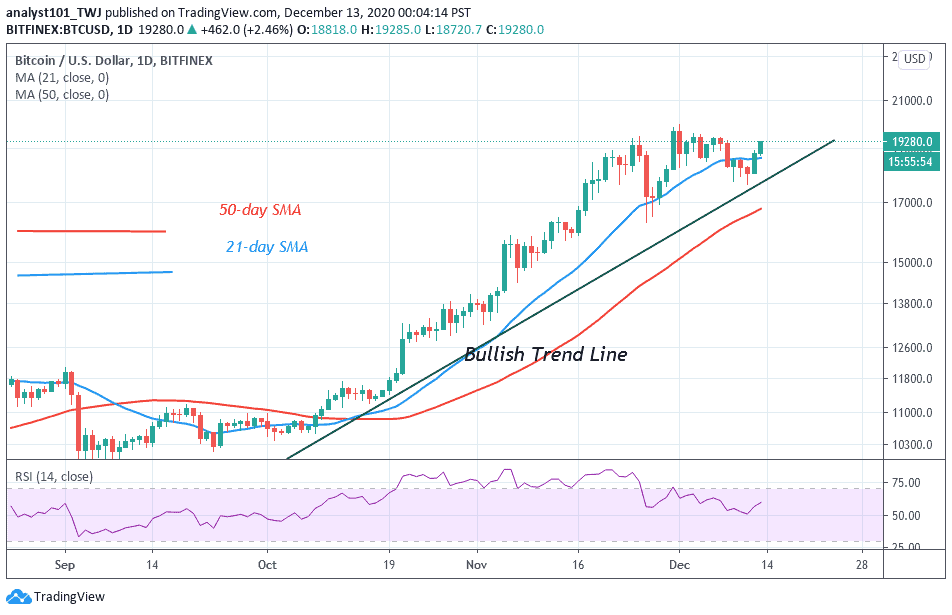
BTC/USD Long-term Trend: Bullish (Daily Chart)
Key levels:
Resistance Levels: $21,000, $21,200, $21,400
Support Levels: $17,300, $17,100, $16,900

BTC/USD is currently trading 2.52% higher on the day. The Bitcoin price opened the session at $18,821 and now adjusting upwards to the prevailing market value of $19,388. The current market movement implies that the market price may stay range-bound during the next few days as the coin moves above 9-day and 21-day moving averages. Meanwhile, the technical indicator RSI (14) may cross above the 60-level.
What to Expect from Bitcoin (BTC)
At the opening of the market today, after testing the low of $18,730, BTC/USD is currently trading at $19,295. Meanwhile, looking at the market movement, there is likely that the market may experience a quick bullish rally to the crucial $20,000, and traders may see $18,800 to $19,000 being tested again before pushing higher.
Looking at the downside, should in case the market decides to fall, the price of Bitcoin could fall below the moving averages at $18,500, and if that support fails to hold the sell-off, traders could see a further decline below the lower boundary of the channel and towards the support levels of $17,300, $17,100 and critically $16,800. All the same, any further bullish movement towards the upper boundary of the channel may hit the resistances at $21,000, $21,200, and $21,400.
BTC/USD Medium – Term Trend: Bullish (4H Chart)
According to the 4-hour chart, the Bitcoin price first went up but has dropped slightly within 24 hours. If the price continues to drop further and move below the 9-day moving average, it could reach the nearest support levels at $18,600, $18,400, and $18,200 respectively.
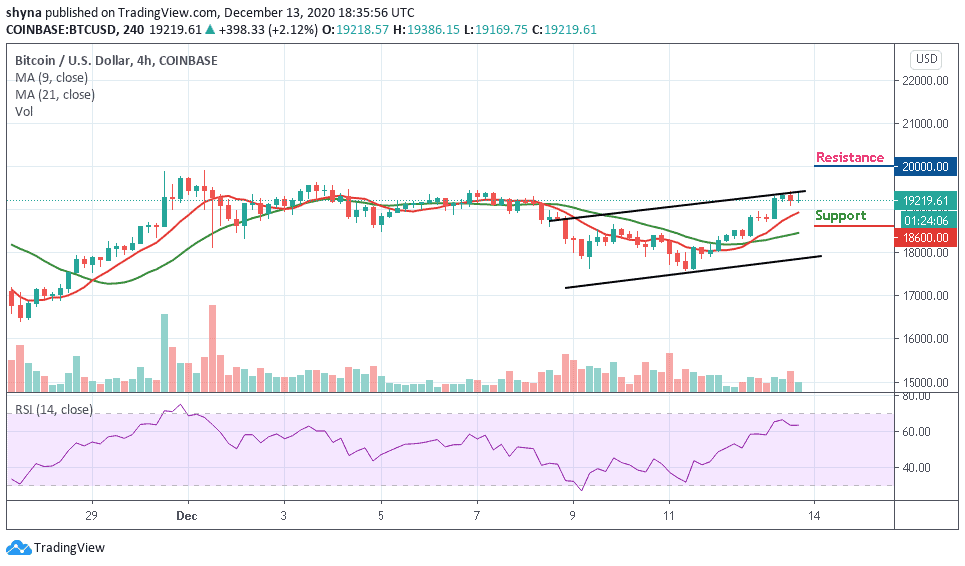
Moreover, if the bulls push the coin above the upper boundary of the channel, the price of Bitcoin may likely reach the potential resistance levels of $20,000, $20,200, and $20,400. Presently, the market is indecisive as the RSI (14) indicator moves around the 63-level.
Join Our Telegram channel to stay up to date on breaking news coverage