Join Our Telegram channel to stay up to date on breaking news coverage
Bitcoin (BTC) Price Prediction – December 12
BTC/USD price is trading nicely above the $18,400 and the coin must climb above the moving averages to continue higher.
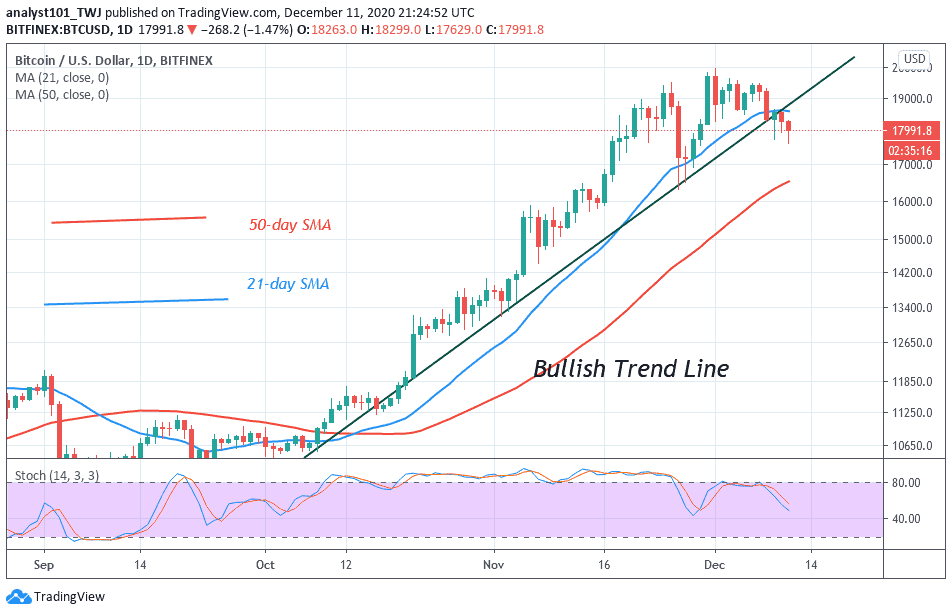
BTC/USD Long-term Trend: Bullish (Daily Chart)
Key levels:
Resistance Levels: $20,000, $20,200, $20,400
Support Levels: $16,600, $16,400, $16,200
BTC/USD bullish movement may come back into action after battering with the bearish movement for the past few days. Should in case this comes to play out, the expectation of recovery could turn out to be true. At the time of writing, BTC/USD is trading at $18,415 after soaring to $18,530 in the early hours of today’s trading. The coin now pulls back to where it is trading currently.
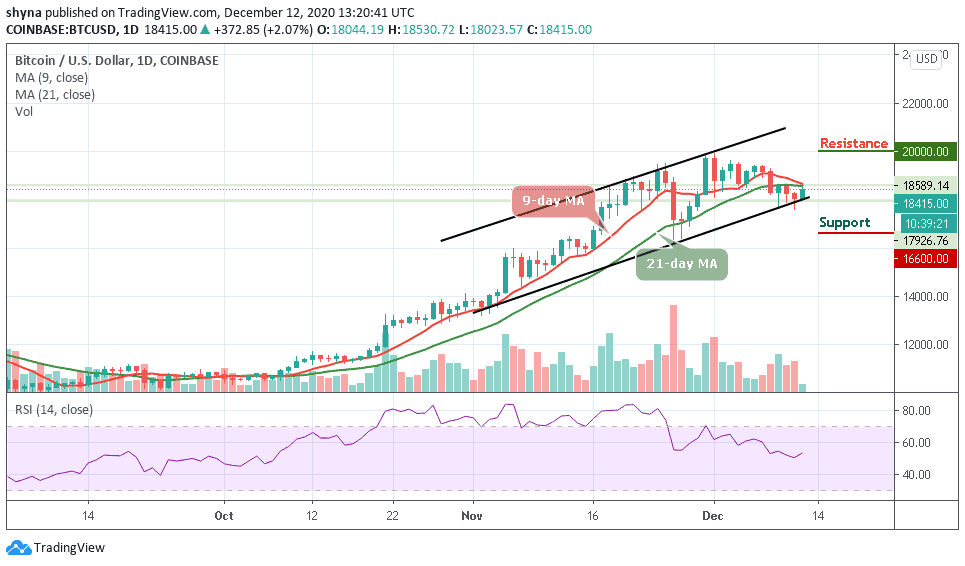
Where is BTC Price Going Next?
The first digital asset is deciding around $18,415 below the 9-day and 21-day moving averages, where the buyers and sellers are anticipating a clear breakout or breakdown. Meanwhile, the $19,000 and $19,500 levels may further surface as the key resistances should the $18,500 level holds. However, a strong bullish spike may take the price to $20,000, $20,200, and $20,400 levels.
Moreover, if the market makes a quick turn to the south, the Bitcoin price may likely revisit $17,500, and should this support fails to contain the sell-off; traders may see a further roll back to $16,600, $16,400, and critically $16,200. On the other hand, the technical indicator RSI (14) suggests an upward movement for the coin as the signal line moves above 50-level.
BTC/USD Medium – Term Trend: Bearish (4H Chart)
On the 4-hour chart, BTC is still following the bearish trend, the cryptocurrency has been showing a sign of weakness since the beginning of this month. Meanwhile, the hourly trading is looking bullish; following the recent rebound at $18,023 which is now a key support level. The next key support levels are $18,000 and below.
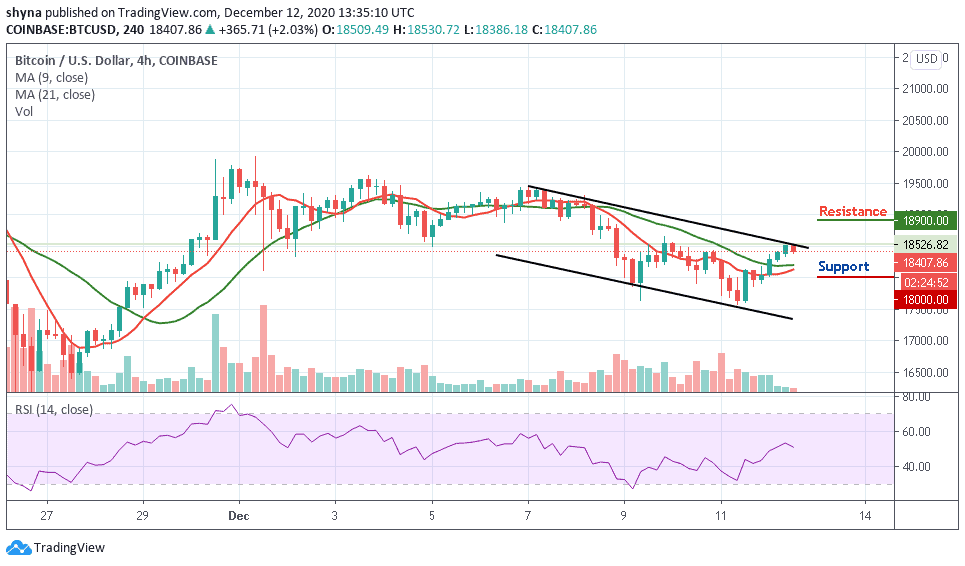
Moreover, considering the recent rebounds, the Bitcoin price may re-enter the bullish rally to $18,500 resistance. A climb above the upper boundary of the channel may further push BTC price to $18,900 and above. As it is now, bears may likely return into the market as the RSI (14) moves below 53-level, which could resume the downward direction.
Join Our Telegram channel to stay up to date on breaking news coverage