Join Our Telegram channel to stay up to date on breaking news coverage
Bitcoin (BTC) Price Prediction – December 4
BTC/USD is currently in the hands of the sellers but consolidation is likely between $18,500 and $19,000.
BTC/USD Long-term Trend: Bullish (Daily Chart)
Key levels:
Resistance Levels: $20,800, $21,000, $21,200
Support Levels: $17,800, $17,600, $17,400
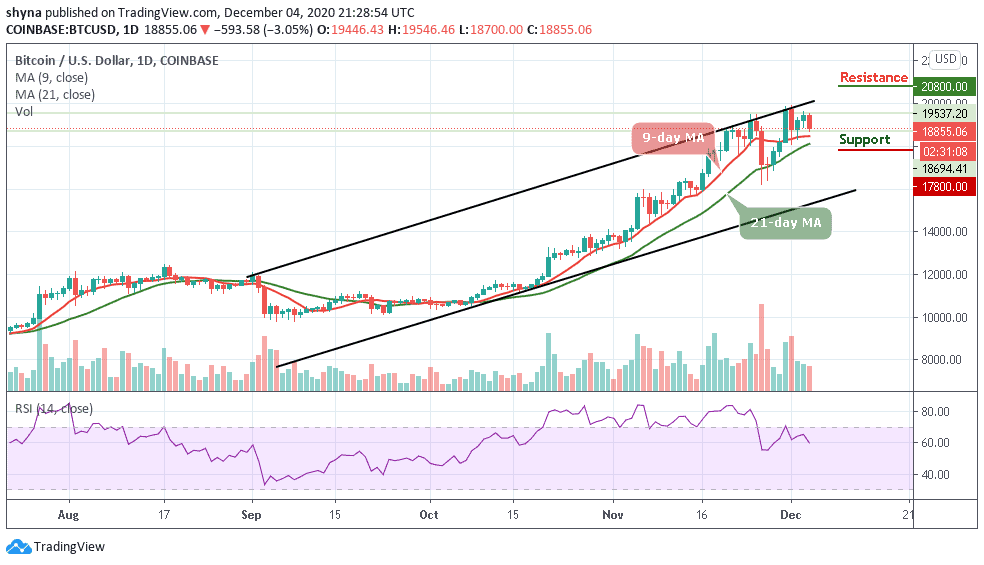
At the beginning of this week, BTC/USD turned heads with its majestic rise to highs above the potential $19,915 level. Meanwhile, the BTC price did not stay up for long because of an immediate reversal. In the early hours of yesterday, BTC/USD held on to the support above $18,700 but the market still remains above the 9-day and 21-day moving averages.
Possible Next Direction for BTC/USD
The Bitcoin price remains in the consolidation mode above the moving averages, deciding on the next move. However, it can be expected that the market may continue to sell should in case the coin break below the moving averages. Therefore, if the bulls continue to show a strong commitment, BTC/USD could rise above the upper boundary of the channel and may reach the potential resistance levels of $20,800, $21,000, and $21,200 while the RSI (14) indicator faces the south, may continue to give bearish signals.
Nevertheless, the daily chart shows that the weak upward momentum may be affecting the Bitcoin bulls, although bears may likely bring the price below the moving averages which could lead the Bitcoin price to the supports of $17,800, $17,600, and $17,400 in the next negative moves.
BTC/USD Medium-Term Trend: Ranging (4H Chart)
Bitcoin’s price is now trading around $18,825 after touching the high of $19,456. Looking at the 4-hour price chart, traders can see that the bears are dragging the price below the 9-day and 21-day moving averages. Meanwhile, the $18,300 support level and below may come into play if BTC breaks the lower boundary of the channel.
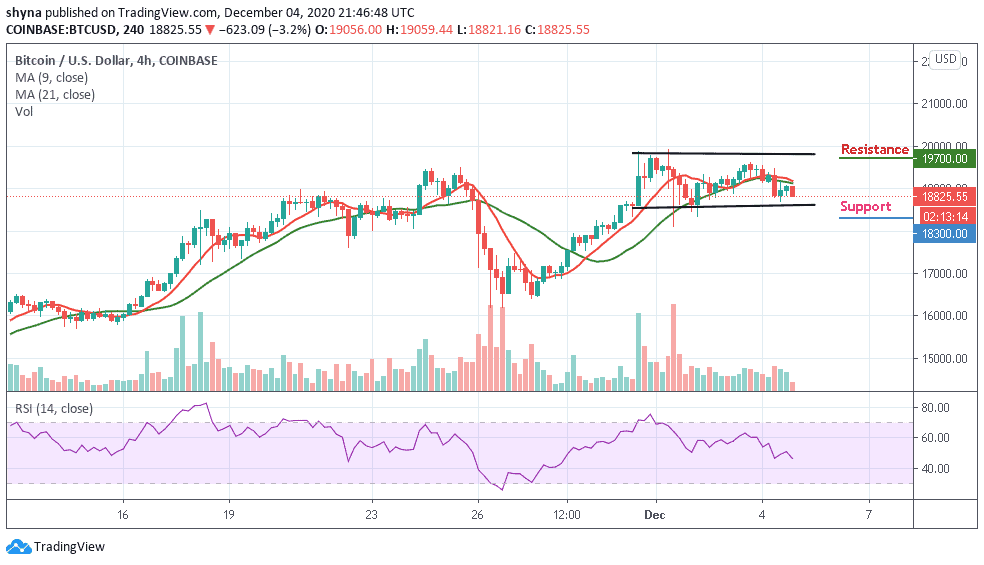
However, if buyers could strengthen and push the market price above the moving averages, the coin is expected to revisit the $19,500 resistance level. Therefore, breaking the mentioned resistance level may push the king coin to $19,700 and above. However, BTC/USD is consolidating and moving sideways on the medium-term outlook as the RSI (14) moves below the 50-level.
Join Our Telegram channel to stay up to date on breaking news coverage