

Join Our Telegram channel to stay up to date on breaking news coverage
Bitcoin (BTC) Price Prediction – December 2
The price of Bitcoin rebounds above $19,000, despite the pressure from the sellers.
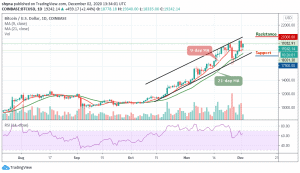
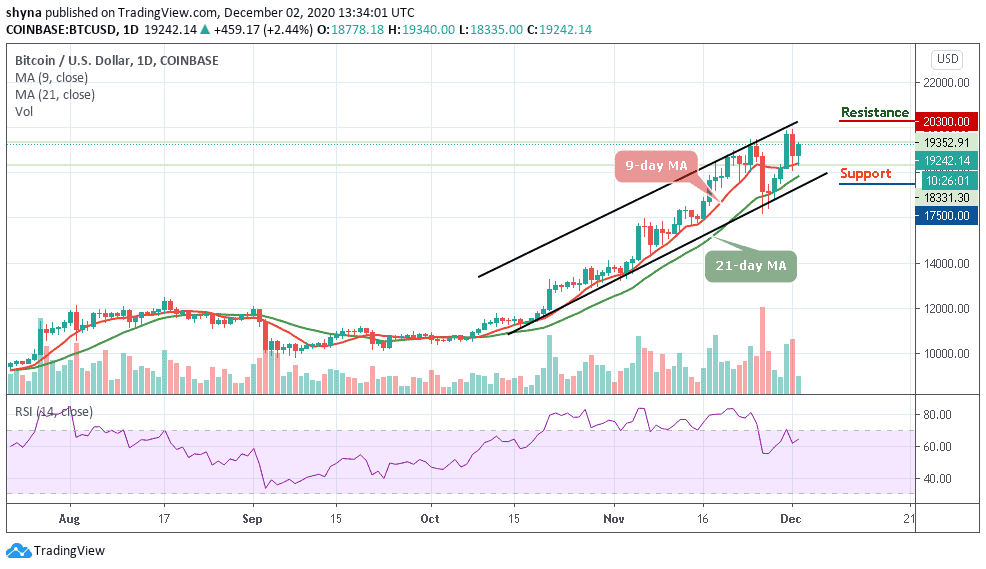
BTC/USD Long-term Trend: Bullish (Daily Chart)
Key levels:
Resistance Levels: $21,800, $22,000, $22,200
Support Levels: $16,800, $16,600, $16,400
As reveals by the daily chart, BTC/USD is leading the pack after regaining ground above $19,000. The cryptocurrency market is on the rise again, after retracing in the last 24 hours. Meanwhile, the top ten cryptocurrencies are in the green, considering the percentage change per hour. Yesterday, the rejection from levels close to $20,000 lost traction before hitting $18,000. The buyers are now taking the advantage of the support at the 9-day MA to force the on-going reversal.
What to Expect from BTC/USD
At the time of writing, BTC/USD is dancing slightly above $19,200 while bulls work extra hard to boost the $20,000 resistance level. The cheerful optimism seems to have been validated by the technical indicator RSI (14), as it rebounds above the 60-level heading to the overbought region. However, the first digital asset could trigger a massive bull run if it breaks the resistance at the newly achieved all-time high at 19,900. Moreover, trading above $20,000 may see the king of cryptocurrencies enter the price discovery mode.
Therefore, any further bullish movement above $20,000 could locate the potential resistance levels of $20,300, $20,500, and $20,700. On the other hand, a bearish narrative may come into the picture if Bitcoin closes the day under $19,000. Breaking below the lower boundary of the channel might trigger massive sell orders creating enough volume to force BTC into a downtrend while the critical supports may be located at $17,500, $17,300, and $17,100.
BTC/USD Medium-Term Trend: Ranging (4H Chart)
On the 4-hour chart, Bitcoin’s price is currently trading around $19,149 around the 9-day moving average after rebounding from the $18,800 low. Whereas, the 4-hour chart shows that the coin may likely experience a sideways movement as the signal line of RSI (14) is seen moving in the same direction below the 60-level.
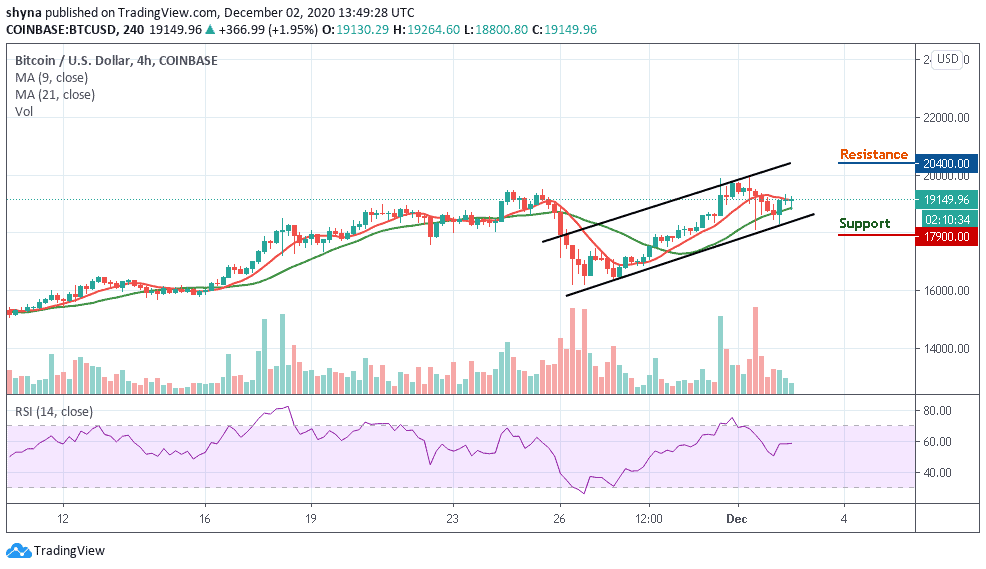
Therefore if the market price remains below the 9-day and 21-day moving averages, keeping Bitcoin above $19,500 may be a daunting task. Meanwhile, the best support levels we may look at are $17,900, $17,700, and $17,500 while the potential resistance lies at $20,400 and above.
Join Our Telegram channel to stay up to date on breaking news coverage
