Join Our Telegram channel to stay up to date on breaking news coverage
Bitcoin (BTC) Price Prediction – November 22
The Bitcoin price continues to trend within the seller congestion zone between $18,800 and $17,610.
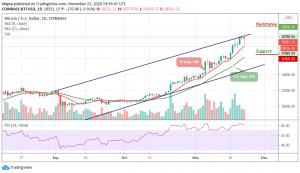
BTC/USD Long-term Trend: Bullish (Daily Chart)
Key levels:
Resistance Levels: $20,000, $20,200, $20,400
Support Levels: $16,500, $16,300, $16,100

BTC/USD is seen trading above the 9-day and 21-day moving averages. The cryptocurrency briefly stepped above the stubborn resistance at $18,700 today where it moves very close to $19,000. Unfortunately, the momentum fizzled out, culminating in a drop back into the range of $18,800 – $17,610. At the time of writing, BTC/USD is exchanging hands at $18,551 amid a growing bearish grip.
Where is BTC Price Going Next?
The technical indicator RSI (14) is seen facing the south as the signal line ready to cross below 80-level which simply means that the king coin is not done with the downside. Despite the drop suffered, the RSI (14) is still within the overbought zone which simply means that there is still room that could be explored by the sellers. Moreover, the coin may continue to follow the downtrend if the price crosses below the 9-day and 21-day moving averages.
Meanwhile, a sustainable move above the upper boundary of the channel may negate the bearish scenario and allow for an extended recovery towards the resistance levels at $20,000, $20,200, and $20,400. However, an increase in selling pressure across the market could force the BTC/USD towards a painful path and through various tentative supports at $16,500, $16,300, and $16,100.
BTC/USD Medium-Term Trend: Bullish (4H Chart)
On the 4-hour chart, BTC/USD should recover above $18,800 above the 9-day and 21-day moving averages to mitigate the short-term bearish pressure and allow for an extended recovery towards $19,000. A higher resistance may be found at $19,200 and $19,400 resistance levels.
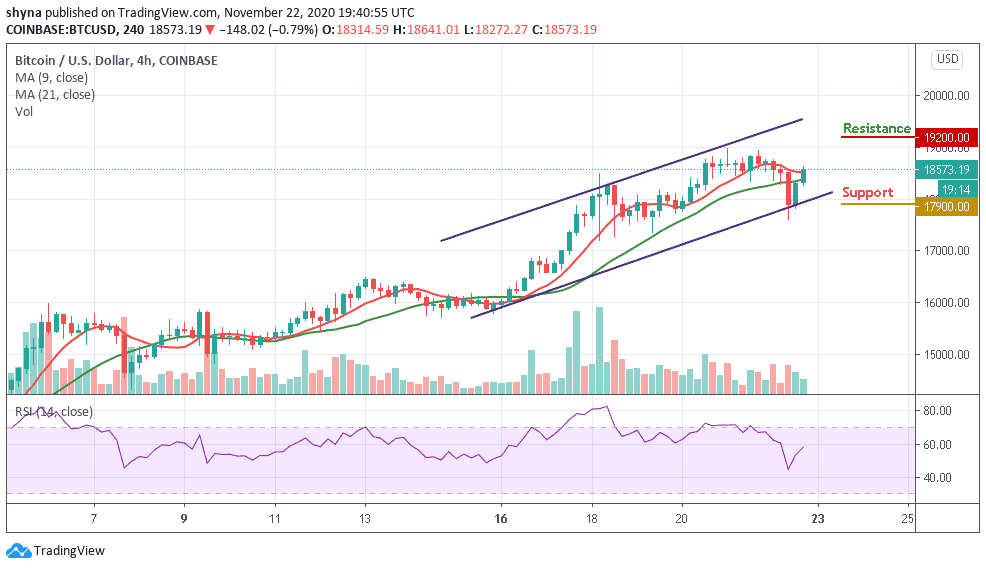
In contrast, the nearest support is at $18,000, and a sustainable move below this level may increase the downside pressure and push the price towards $17,900 and $17,700 support levels. The traders may need to consider that the signal line of the technical indicator is starting to revert to the upside, we might expect that the bull’s case scenario may play out.
Join Our Telegram channel to stay up to date on breaking news coverage