Join Our Telegram channel to stay up to date on breaking news coverage
Bitcoin (BTC) Price Prediction – November 15
If BTC/USD manages to flip $16,100 into a support level, the king coin may likely push to new trend highs at $16,500 and beyond.
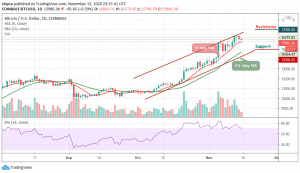
BTC/USD Long-term Trend: Bullish (Daily Chart)
Key levels:
Resistance Levels: $17,000, $17,200, $17,400
Support Levels: $15,000, $14,800, $14,600

According to the daily chart, BTC/USD is recovering back to the upside. At the moment, BTC/USD is seen trading at $15,986 after touching the daily low of $15,796 in the early hour of today. The coin is also seen pulling back to where it is trading currently and could head upwards if the bulls step back into the market.
What to Expect from Bitcoin (BTC)
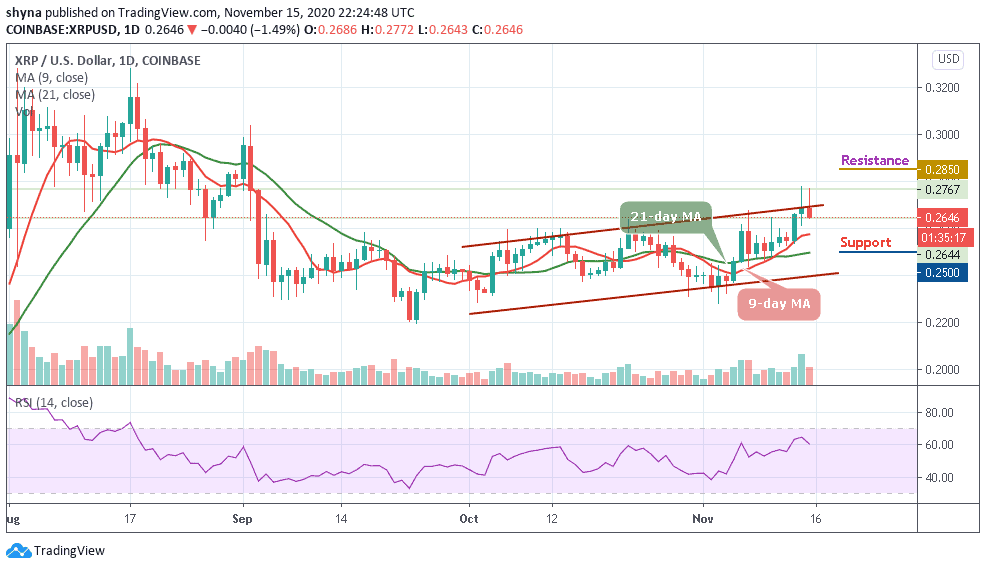
On the bearish side, it is important for Bitcoin to hold the 9-day and 21-day moving averages within the channel and confirm it otherwise there can come a bearish breakdown when BTCUSD falls below that barrier. The technical indicator RSI (14) is sending moderate signs as the signal line remains within the overbought zone.
However, BTC/USD will confirm the bullish trend if the market price moves above the upper boundary of the channel while it will continue the bearish trend if the price moves below the moving averages. Meanwhile, a strong bullish spike above the channel may likely take the price to the resistance levels of $17,000, $17,200, and $17,400. Meanwhile, any further bearish movement could lead to the critical supports at $15,000, $14,800, and $14,600 respectively.
BTC/USD Medium-Term Trend: Bearish (4H Chart)
According to the 4-hour chart, BTC/USD is trading below the moving averages at $15,993. However, intraday trading is still looking bearish; at the beginning of today’s trading at $16,082. Meanwhile, the next key support levels are located at $15,600, $15,400, and $15,200.
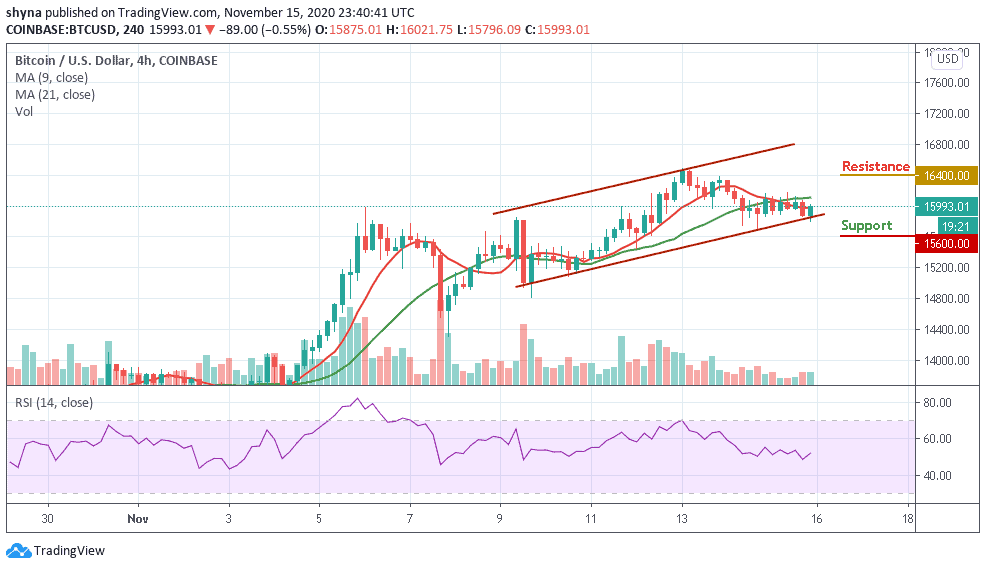
However, in as much as the buyers continue to reinforce and power the market more, traders can expect a retest at the $16,100 resistance level, and breaking this level may further push the price towards the resistance level of $16,400 and above. Similarly, the RSI (14) faces the north to confirm the bullish movement.
Join Our Telegram channel to stay up to date on breaking news coverage