Join Our Telegram channel to stay up to date on breaking news coverage
Bitcoin (BTC) Price Prediction – November 13
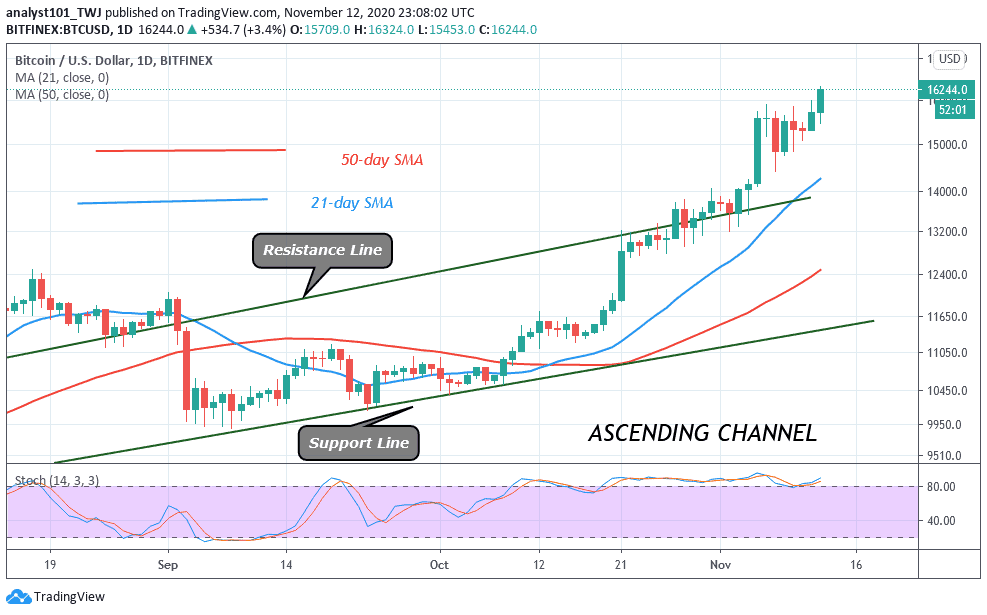
The strong bullish daily candle formed yesterday on the daily chart indicates that the bulls are fully in control.
BTC/USD Long-term Trend: Bullish (Daily Chart)
Key levels:
Resistance Levels: $17,700, $17,900, $18,100
Support Levels: $14,700, $14,500, $14,300
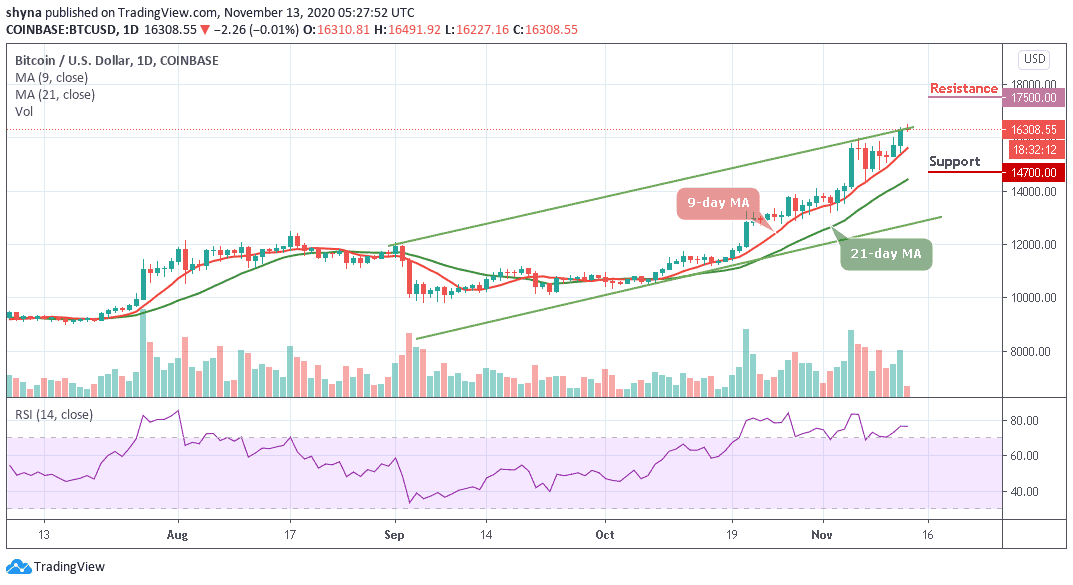
As the daily chart reveals, BTC/USD is currently on the bullish trend as the bulls begin to show immense signs of strength above the 9-day and 21-day moving averages with no signs of slowing. The Bears lost the momentum at the support level of $15,446 yesterday and could not penetrate below the level. The first digital asset bounced and propelled towards the north.
What to Expect from Bitcoin (BTC)
The Bitcoin price is now moving above the crucial levels which may function as the support zones in the event a reversal occurs. Meanwhile, on the upside, as the coin moves and breaks out of the ascending channel, little is in place to prevent correction targeting the key resistance of $16,500 as the technical indicator RSI (14) is seen moving within the overbought territory.
Furthermore, according to the daily chart, BTC/USD is banking on the support at the 9-day moving average to ensure that in spite of a reversal, the Bitcoin price stays above the $15,500 level. Similarly, the nearest resistance levels to watch are $17,700, $17,900, and $18,100 while the support levels to keep an eye on are $14,700, $14,500, and $14,300 respectively.
BTC/USD Medium – Term Trend: Bullish (4H Chart)
The 4-hour chart shows that the price may continue to find its way upward as the RSI (14) remains at the upside. Although the market may experience a little bit of retreat, the bulls are set to defend the $15,800 support and push the price towards the north.
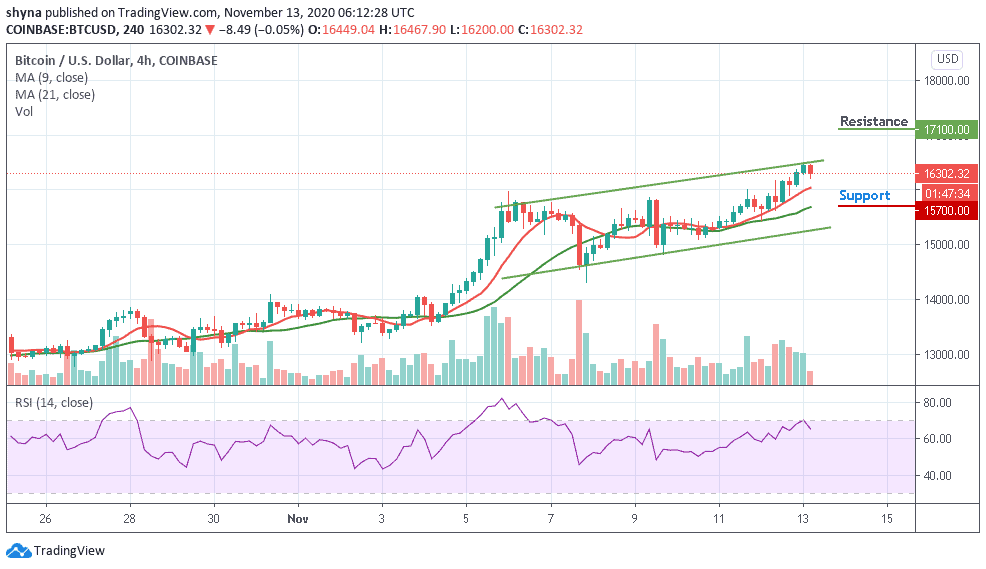
However, should in case the bulls failed; the support level of $15,700 and below may come into play if the price breaks below the 9-day MA. But in as much as the buyers put more pressure into the market and cross above the upper boundary of the channel, the price could hit a resistance level of $17,100 and above.
Join Our Telegram channel to stay up to date on breaking news coverage