Join Our Telegram channel to stay up to date on breaking news coverage
Bitcoin (BTC) Price Prediction – November 11
The Bitcoin price is currently hovering at $15,800 after slipping below $14,500 a few days ago.
BTC/USD Long-term Trend: Bullish (Daily Chart)
Key levels:
Resistance Levels: $16,800, $17,000, $17,200
Support Levels: $14,500, $14,300, $14,100
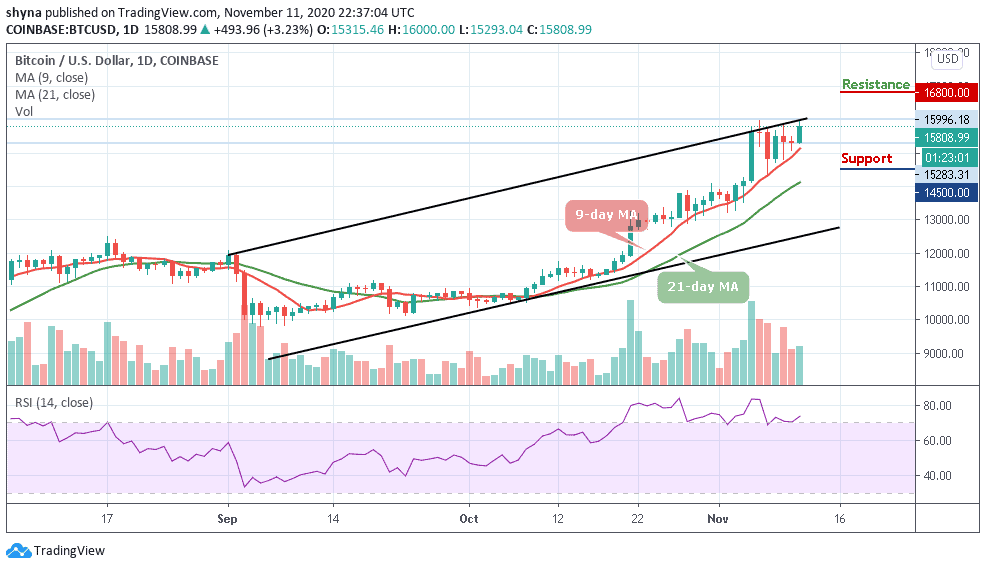
BTC/USD bulls are currently pushing higher today, this latest move marks an upwards break of the consolidation phase seen as of late, but it is important to note that it has not led BTC past any key technical levels. Bitcoin has been consolidating over the past few days, struggling to gain any momentum as the entire market’s uptrend stalls.
Would Bitcoin Go Up or Down?
BTC/USD is trading up marginally at its current price of $15,808. Although this only marks a slight climb from where it has been trading throughout the past several days but it is important to note that this seems to mark a bull-favoring break above the 9-day and 21-day moving averages of the tight trading range seen over the past few days. However, this range existed between $14,800 and $15,800, coming about as a result of the cryptocurrency’s severe lack of directionality.
However, as the RSI (14) remains within the overbought territory, a sustainable move above the upper boundary of the channel may likely locate the potential resistance of $16,800, reaching this may also allow for an extended recovery towards $17,000 and $17,200 respectively. Meanwhile, an increase in selling pressure may force the RSI (14) to cross below the 70-level and move towards the tentative supports at $14,500, $14,300, and $14,100.
BTC/USD Medium-Term Trend: Bullish (4H Chart)
On the 4-hour chart, BTC/USD may recover above $16,000 at the upper side to mitigate the short-term bearish pressure and this may allow for an extended recovery towards $16,200. A higher resistance may be found at $16,500 and above.
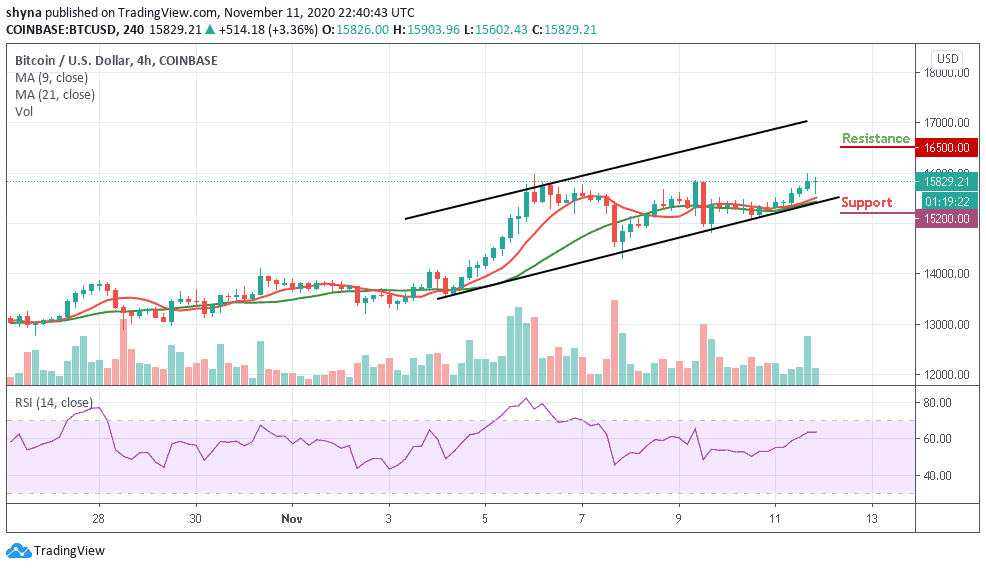
In other words, the nearest support is located below the lower boundary of the channel, and a sustainable move below this barrier may increase the downside pressure and push the price towards the support level of $15,200 and below. More so, the RSI (14) is moving above the 60-level, more bullish signals may come into focus.
Join Our Telegram channel to stay up to date on breaking news coverage