Join Our Telegram channel to stay up to date on breaking news coverage
Bitcoin (BTC) Price Prediction – November 11
Stability has returned to the market, with Bitcoin bouncing towards the long-awaited resistance level of $16,000.
BTC/USD Long-term Trend: Bullish (Daily Chart)
Key levels:
Resistance Levels: $16,700, $16,900, $17,100
Support Levels: $14,700, $14,500, $14,300
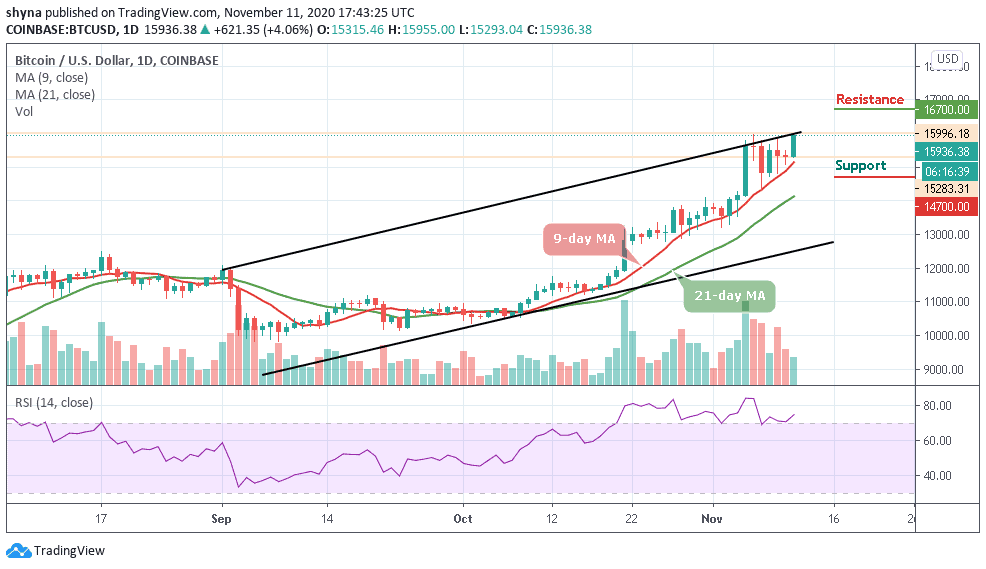
According to the daily chart, BTC/USD is projected in an ascending broadening wedge as price currently targets a $16,000 resistance level. The bulls have been gaining control of the market since October. Though, $15,800 has been a crucial price level for the bulls to surpass in the past few days of trading. The coin is now hovering above the 9-day and 21-day moving averages at $15,936, ready to break above the upper boundary of the channel.
What to Expect from Bitcoin (BTC)
Since the last high at $15,977, BTC/USD is yet to throw another significant price level. Looking at the movement of the market, the bulls may encounter a solid resistance at the above price level. At the moment, the Bitcoin price still appears heading up; a possible bullish break could look for the potential resistance at $16,500. Getting rejected may drop the price to the nearest support of $15,000.
However, the next few days of trading would determine the next price level. Meanwhile, for the past two weeks, BTC/USD has attempted to breach the $15,900 level which was last rejected around $15,977. Moreover, the technical indicator RSI (14) is within the overbought region. Therefore, if the current price successfully surpasses the mentioned level, the next bull-run would meet $16,700, $16,900, and $17,100 resistance levels. A strong rejection may plunge the Bitcoin price to the supports at $14,700, $14,500, and $14,300 supports.
BTC/USD Medium – Term Trend: Bullish (4H Chart)
Since the price of BTC falls from the resistance level of $15,977 a few days ago, the 9-day and 21-day moving averages have been strong support and resistance levels. Now, if price crossover the upper boundary of the channel, BTC/USD may print a new high around $16,200.
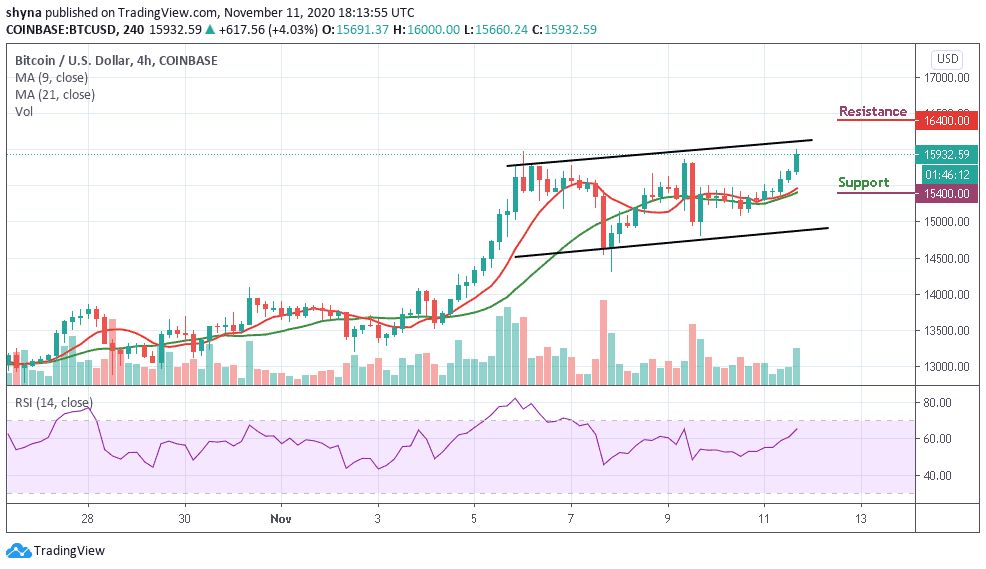
However, the technical indicator RSI (14) is seen moving above the 40-level, any further bullish movement may likely take the Bitcoin price to the resistance level of $16,400 and above. In other words, a break below the 9-day and 21-day moving averages could plunge the BTC price to the supports at $15,400 and below.
Join Our Telegram channel to stay up to date on breaking news coverage