

Join Our Telegram channel to stay up to date on breaking news coverage
Bitcoin (BTC) Price Prediction – November 8
Bitcoin (BTC) stands firm as the market price remains at the upside.
BTC/USD Long-term Trend: Bullish (Daily Chart)
Key levels:
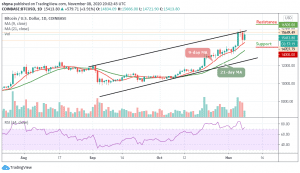
Resistance Levels: $16,500, $16,700, $16,900
Support Levels: $14,000, $13,800, $13,600
BTC/USD is currently caught within a slight uptrend, as the first digital asset is pushing up towards $15,800 as sellers begin losing their edge over bulls. More so, the strength of the buying pressure within this level should not be underestimated, as bears could not break it despite making several attempts to do so.
What is the Next for Bitcoin?
As the daily chart reveals, the strength in BTC/USD high time frame market structure seems to indicate that a bullish movement towards $16,000 resistance level could be imminent in the near-term. At the time of writing, BTC/USD is hovering at its current price of $15,413 which marks a notable rise from recent lows of $14,721. Meanwhile, the sellers did not have enough strength to shatter this price level as it appears that the bulls now have the upper hand within the ascending channel.
Nonetheless, if the market decides to face the south, the Bitcoin price may fall below the 9-day moving average at $14,500, but if that support fails to hold the sell-off, the market may experience a further decline towards the supports at $14,000, $13,800, and critically $13,600. All the same, any further bullish movement above the channel may hit the resistances at $16,500, $16,700, and $16,900 as the RSI (14) moves within the overbought conditions.
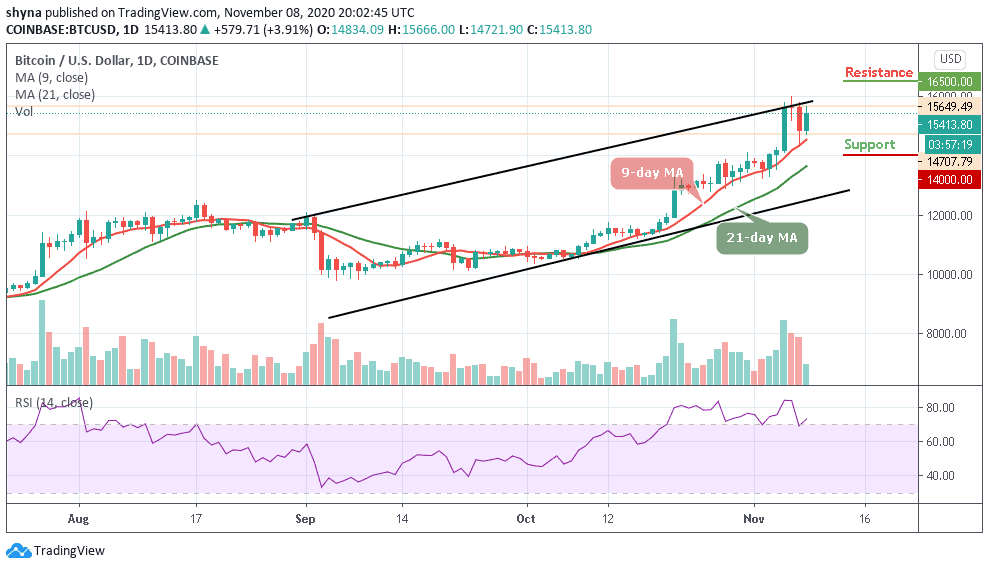
BTC/USD Medium – Term Trend: Bullish (4H Chart)
On the 4-hour chart, traders have seen the bullish movement which is quite notable on the structural outlook. BTC/USD trading is steady above $15,423 as the crypto-asset moves to test the $15,666 resistance level. From above, further bullish movement may likely meet the potential resistance at around the $16,000 and $16,200.
As of now, the technical indicator RSI (14) is reflected in the positive zone, moving around the 60-level. Meanwhile, a significant cross below this level may likely send the market price in a bearish scenario and the nearest supports are located at $14,700 and below.
Join Our Telegram channel to stay up to date on breaking news coverage
