Join Our Telegram channel to stay up to date on breaking news coverage
Bitcoin (BTC) Price Prediction – November 5
The Bitcoin (price) is caught in the middle of a bull market as its price rises to $15,000.
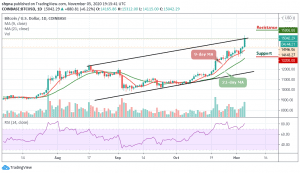
BTC/USD Long-term Trend: Bullish (Daily Chart)
Key levels:
Resistance Levels: $15,800, $16,000, $16,200
Support Levels: $14,400, $14,200, $14,000

BTC/USD is beginning to see some signs of immense strength as buyers propel it up towards $15,000. Meanwhile, this is the highest price the cryptocurrency has seen since its 2017 highs of $20,000, and bulls are now just a stone’s throw away from breaking above this level. However, the buyers are in full control of the market, and there is a strong likelihood that further upside could come about in the next few days.
What to Expect from Bitcoin (BTC)
At the time of writing, Bitcoin (BTC) is trading up 6.22% at its current price of $15,042. Moreover, as the resistance mounts, the movement towards $15,500 may likely come into focus and the next few days may likely reveal where Bitcoin (BTC) and other altcoins will trend for the remaining part of this year.
However, if the bulls can cause the price to remain above the 9-day and 21-day moving averages, moving up further could push the price above the upper boundary of the channel to touch the resistance levels of $15,800, $16,000, and $16,200. Fortunately, the technical indicator RSI (14) is still looking strong within the overbought, suggesting more bullish signals into the market.
BTC/USD Medium – Term Trend: Bullish (4H Chart)
On the 4 hour chart, BTC/USD is trading at $9,134 as all eyes are glued on the $15,500 resistance level. Looking at the chart currently, the coin is seen moving above the channel while the existing trend is still bullish. Therefore, the buyers could remain in the driver seat but rapid price actions may need to play out.
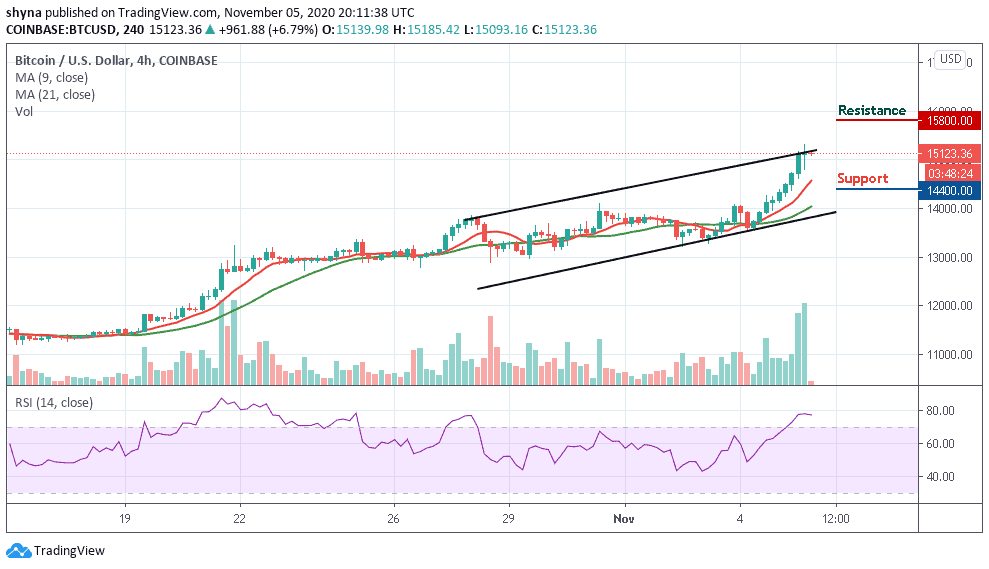
However, at the time of writing, the bullish trend line remained unbroken, which is why Bitcoin’s priority still remains the same and the coin may likely retest the support level of $14,500 and below. Meanwhile, if the technical indicator RSI (14) continues to follow the upward movement, BTC/USD may likely hit the resistance level of $15,800 and above.
Join Our Telegram channel to stay up to date on breaking news coverage