Join Our Telegram channel to stay up to date on breaking news coverage
Bitcoin (BTC) Price Prediction – October 28
Despite bearish action, the Bitcoin daily uptrend remains intact as the coin recovers immediately after touching the daily low of $12,891.
BTC/USD Long-term Trend: Bullish (Daily Chart)
Key levels:
Resistance Levels: $14,500, $14,700, $14,900
Support Levels: $12,200, $12,000, $11,800
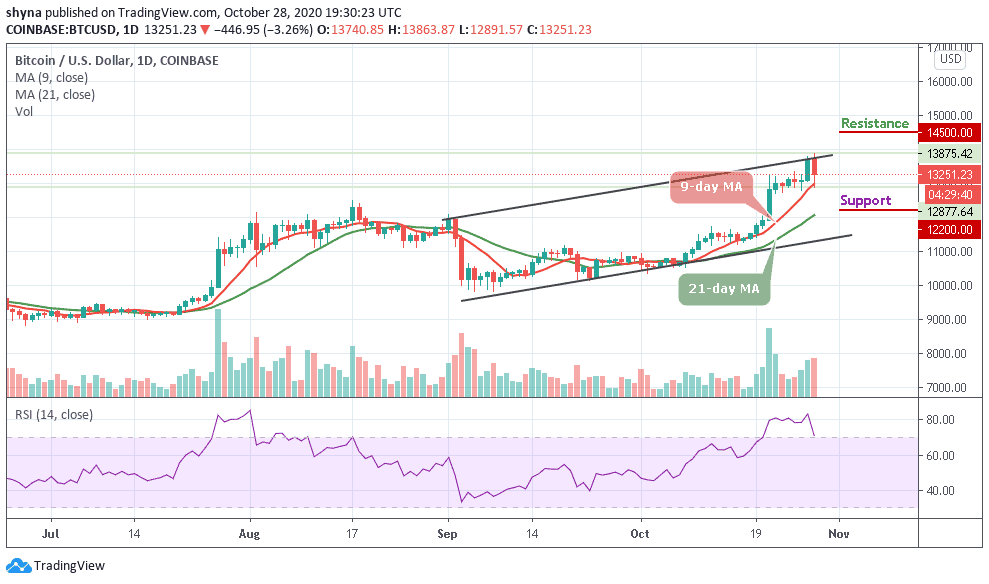
As at the opening of today’s trading, BTC/USD touches the yearly high of $13,863 resistance level. The king coin later drops below $13,000 to touch the daily low of $12,891 but recovers slightly to where it is currently trading at $13,251. However, the bears seem to have taken control within the short-term but the robust daily uptrend remains intact for BTC/USD.
What to Expect from Bitcoin (BTC)
If the Bitcoin (BTC) keeps the bullish movement and the most critical resistance level is still at $13,863. A breakout above this point can easily drive the first digital asset towards the all-time high at $14,000. However, if the bulls can successfully defend the 13,000 support and see a breakout above $13,500, Bitcoin could easily re-test $13,700 in the short-term and perhaps even look at $13,800 as the next target price as there isn’t a lot of resistance on the upside.
On other hand, there are several possible areas that should help prop up Bitcoin prices if the bears step back into the market. The $12,700 and $12,500 may be the first areas to observe if a downtrend begins. From there, we have the critical support levels, which may be located around the $12,200, $12,200, and $11,800 as the technical indicator RSI (14) moves out of the overbought zone. Meanwhile, if the market price remains above the 9-day and 21-day moving averages, the resistance level of $14,500, $14,700, and $14,900 could be visited.
BTC/USD Medium – Term Trend: Bullish (4H Chart)
According to the 4-hour chart, BTC/USD is seen on a downward move and the coin may continue to depreciate if the $13,000 support is broken. The 9-day MA must remain above the 21-day MA, if not, BTC/USD may likely fall and reach the critical supports at $12,800 and below.
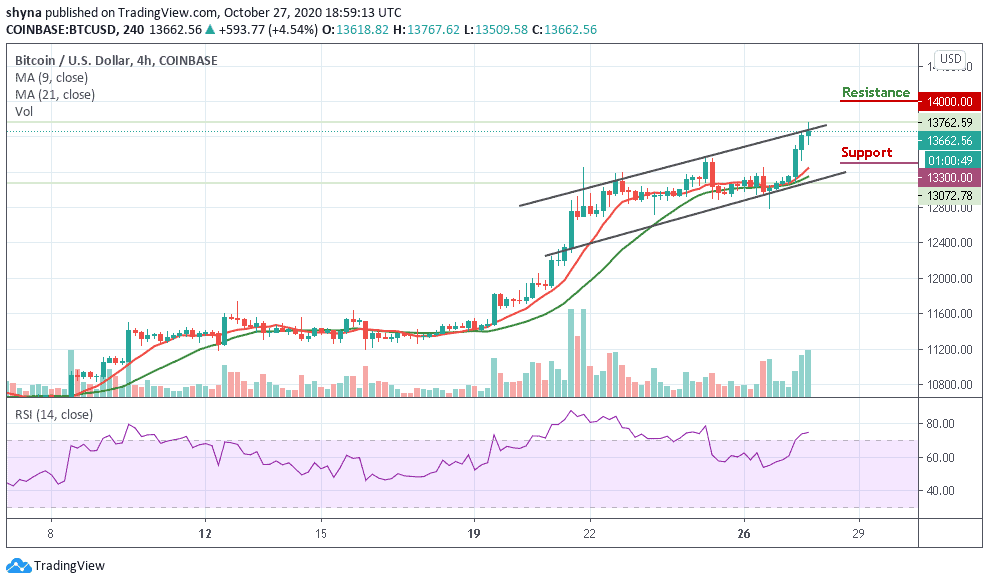
However, if the bulls can hold the current price tight, BTC/USD may likely cross back above the moving averages to reach the potential resistance at $13,600 and above. Meanwhile, the technical indicator RSI (14) is currently moving around the 49-level which may result in sideways movement.
Join Our Telegram channel to stay up to date on breaking news coverage