Join Our Telegram channel to stay up to date on breaking news coverage
Bitcoin (BTC) Price Prediction – October 27
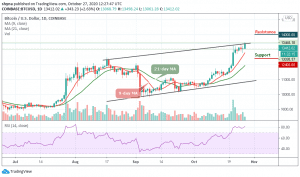
The Bitcoin price is seen trading above $13,400 for the first time in more than three weeks.
BTC/USD Long-term Trend: Bullish (Daily Chart)
Key levels:
Resistance Levels: $14,000, $14,200, $14,400
Support Levels: $12,400, $12,200, $12,000
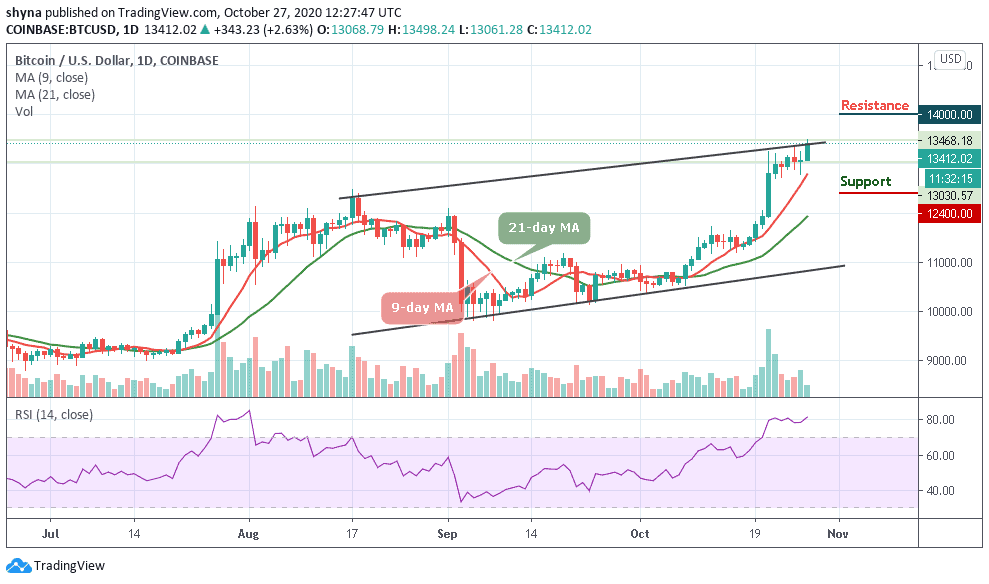
BTC/USD trades above $13,400 for the first time this year. Yesterday, the Bitcoin price dropped massively to levels close to $12,700. However, today’s recovery had been lethargic in the last few weeks, with resistance first at $12,000 and later at $13,000. Today’s breakout above $13,400 paves the way for a flash rally to $13,500 which may be the new month’s high.
Where is BTC Price Going Next?
According to the daily chart, BTC/USD is likely to continue with an uptrend targeting $14,000 in the short term. The buyers have a task to keep the price above $13,400 and even pull above $13,500. A step past $13,500 would encourage more buyers to join the market for another run towards $14,000. Meanwhile, the RSI (14) is moving within the overbought region.
Nevertheless, any failure by the bulls to move the price up, traders may see a price cut to $12,800 vital support. A further low drive could send the price to $12,400, $12,200, and $12,000 supports. For now, the bulls are still dominating the market. But as things stand, the BTC/USD price may continue to follow the upward trend while the nearest resistance lies at $14,000, $14,200, and $14,400 levels.
BTC/USD Medium – Term Trend: Bullish (4H Chart)
The 4-hour chart reveals that the Bitcoin price is surging upwards, catapulting its price to over $13,600 to reach where it currently trades at around $13,662. This sudden rise also pushed the price overall other altcoins, which increased by more than 4.50% in the respective period. However, the closest resistance levels lie at $14,000 and $above, while the nearest supports are $13,300 and below.
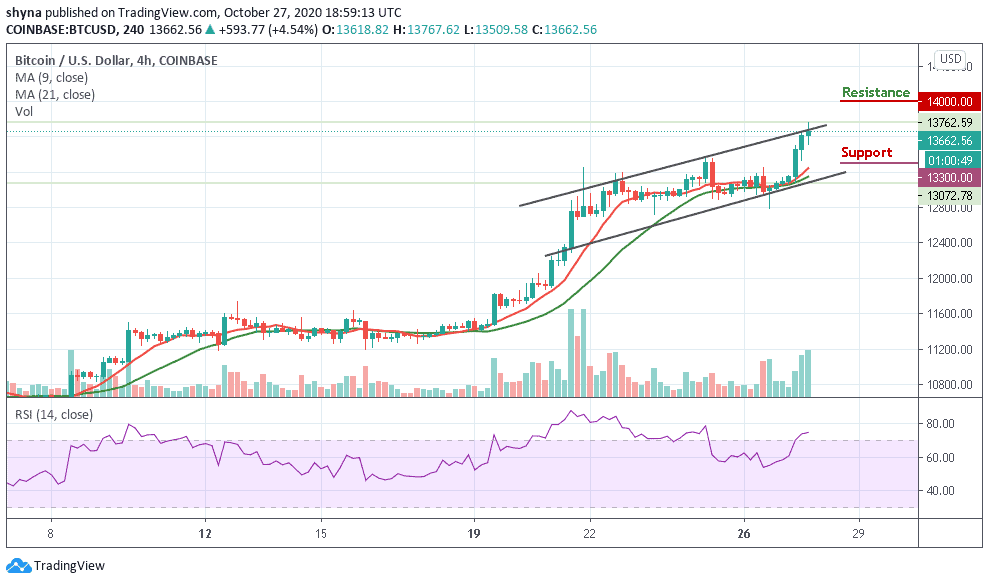
Moreover, as the coin trades above the 9-day and 21-day moving averages, the technical indicator is looking bullish and still flashing buy signals. The RSI (14) indicator is moving within the overbought zone, which indicates a bullish movement at the moment.
Join Our Telegram channel to stay up to date on breaking news coverage