Join Our Telegram channel to stay up to date on breaking news coverage
Bitcoin (BTC) Price Prediction – October 25
The Bitcoin (BTC) has recovered from the recent low on approach to $12,800 but the Bulls may have trouble taking the price above $13,500.
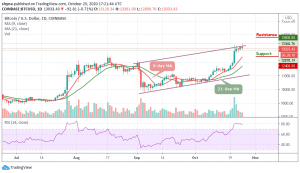
BTC/USD Long-term Trend: Bullish (Daily Chart)
Key levels:
Resistance Levels: $13,800, $14,000, $14,200
Support Levels: $12,400, $12,200, $12,000

BTC/USD resumes the upside trend after a short-lived retreat to $12,890 during early Asian hours. Presently, BTC/USD is changing hands at $13,033 above the 9-day and 21-day moving averages. A sustainable move above $13,200 may bring $13,300 back into focus and improve the technical picture. The coin after touching $13,361 has gained nearly 2% since the beginning of the day but later moved back to touch the low of 12,890.
What is the Next Direction for Bitcoin?
Looking at the daily chart, BTC/USD is still trading above the moving averages. Considering that the RSI (14) may be reversing to the downside from the overbought region, However, BTC/USD may retest $12,800 before another attempt at $13,000 but if $12,800 is broken, the nearest support level of $12,700 may come into focus, followed by $12,500.
Therefore, any failure by the bulls to move the price above the upper boundary of the channel, traders may see a price cut to $12,400, $12,200, and $12,000 supports. For now, the bulls may continue to control the market if the technical indicator remains within the overbought zone. The potential resistance levels are located at $13,800, $14,000, and $14,200.
BTC/USD Medium-Term Trend: Bullish (4H Chart)
At the opening of the market today, the Bitcoin price first went up to touch $13,360 but has dropped slightly within 24 hours, bringing its price below the 9-day and 21-day moving averages but currently trading at $13,015. Should the price remain below the moving averages, it could hit the critical support levels at $12,200 and below.
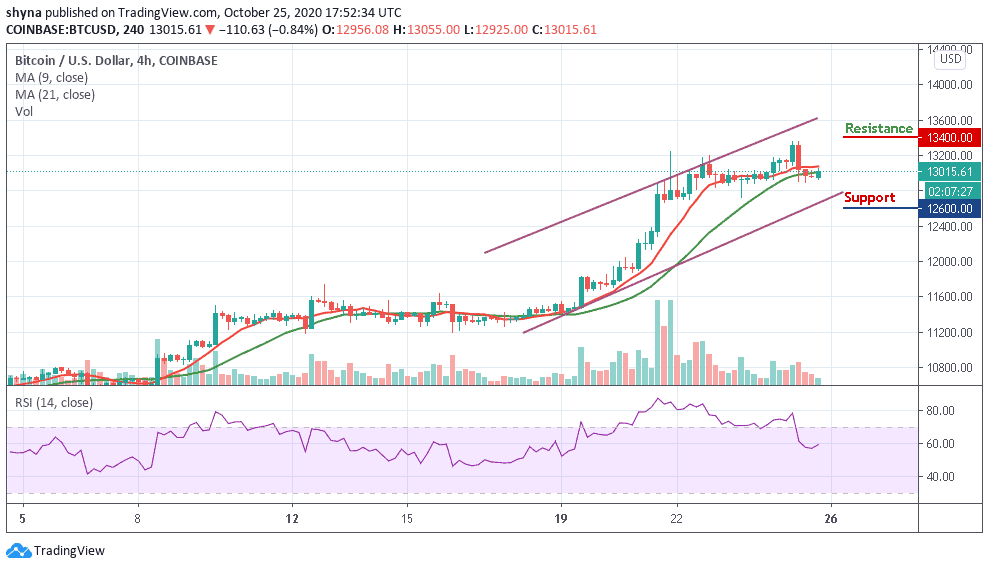
In other words, if the bulls push the coin above the moving averages, the market price may reach the potential resistance levels of $13,400 and above. Meanwhile, the market may follow the downtrend as the RSI (14) indicator remains below the 60-level.
Join Our Telegram channel to stay up to date on breaking news coverage