Join Our Telegram channel to stay up to date on breaking news coverage
Bitcoin (BTC) Price Prediction – October 23
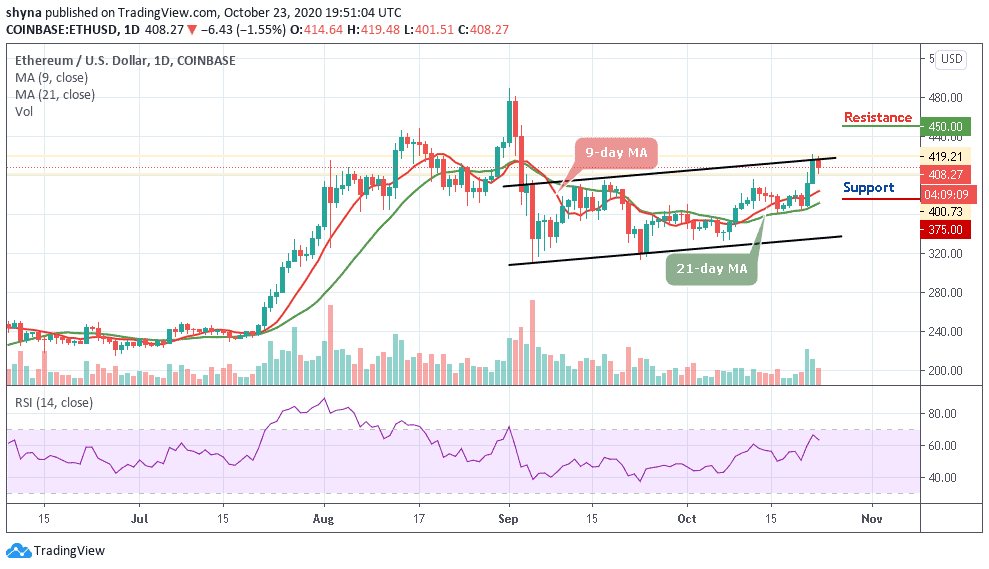
The Bitcoin price has been able to post consistent gains as of late, but now facing down following its slight rejection at $13,200.
BTC/USD Long-term Trend: Bullish (Daily Chart)
Key levels:
Resistance Levels: $13,800, $14,000, $14,200
Support Levels: $12,000, $11,800, $11,600
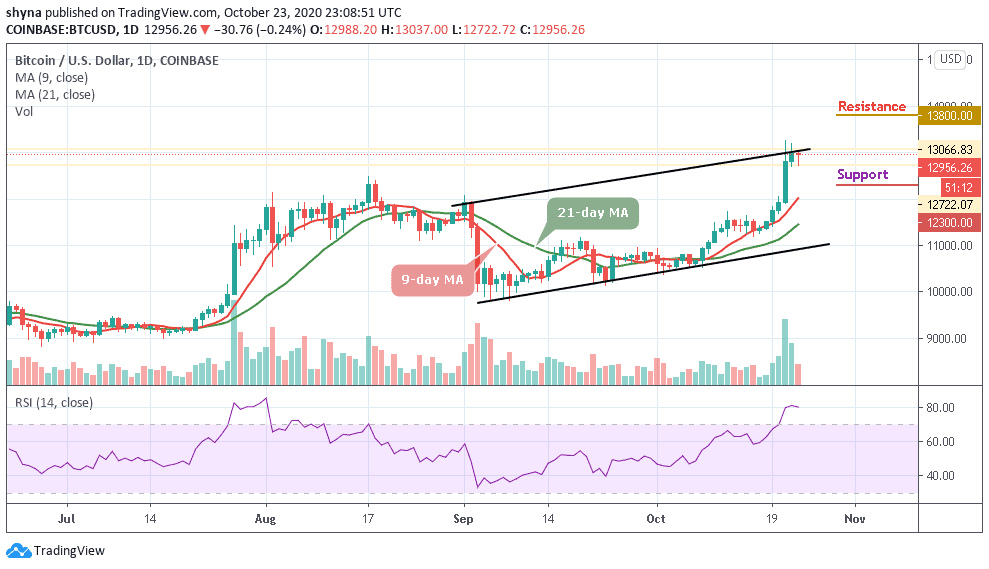
A couple of days ago, BTC/USD blasted over $1,000 to a high of $13,200 and has reignited interest in the crypto market once again in a major way. Meanwhile, a new 2020 high has been set on the BTC/USD pair, but a higher peak over the 2019 top has yet to be reached. However, the leading cryptocurrency by market cap has just set a new all-time high – a stage where it has not reached since the beginning of the year.
What to Expect from Bitcoin (BTC)
In the early Asian session, the Bitcoin price faces a strong rejection after touching the daily high of $13,037, resulting in a sharp decline towards $12,700 again. At the time of writing, BTC/USD is trading down marginally at its current price of $12,956. The recent bearish movement has not been enough to push Bitcoin below the crucial level of $12,700. Nevertheless, the support level of $12,500 could be the next logical target if this continues to hold strong.
However, the entire market trends next may likely depend largely on the supports of$12,300, $12,100, and $11,900 respectively. Meanwhile, until buyers begin to regain some control, its technical outlook remains somewhat unclear and may slightly favor the bears. The resistance levels to watch are $13,800, $14,000, and $14,200 as the RSI (14) remains within the overbought zone.
BTC/USD Medium – Term Trend: Bullish (4H Chart)
According to the 4-hour chart, after touching the $13,022 resistance level, the Bitcoin price dropped slightly to touch the low of $12,722 below the 9-day moving average. Meanwhile, should the price continue to drop further and move below the 21-day moving average, it could reach the support levels at $12,700 and below.
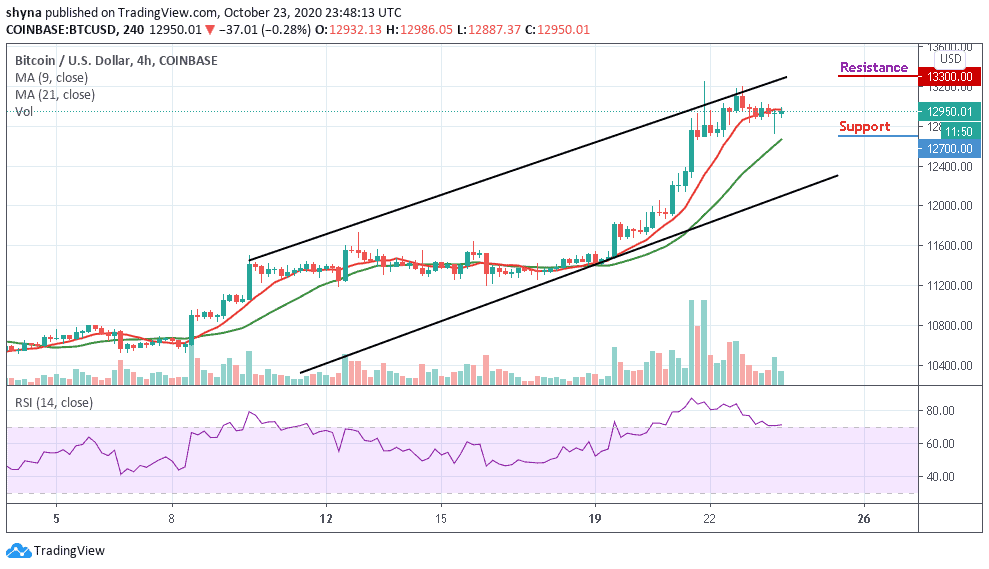
However, if the bulls push the coin above the upper boundary of the channel, the Bitcoin price may likely reach the potential resistance level of $13,300and above. Presently, the market may either move sideways or experience downtrends as the RSI (14) indicator prepares to move out of the overbought zone.
Join Our Telegram channel to stay up to date on breaking news coverage