Join Our Telegram channel to stay up to date on breaking news coverage
ETH Price Prediction – October 22
The Ethereum (ETH) is currently trading at $408 after a significant dip towards $400.
ETH/USD Market
Key Levels:
Resistance levels: $450, $460, $470
Support levels: $375, $365, $355
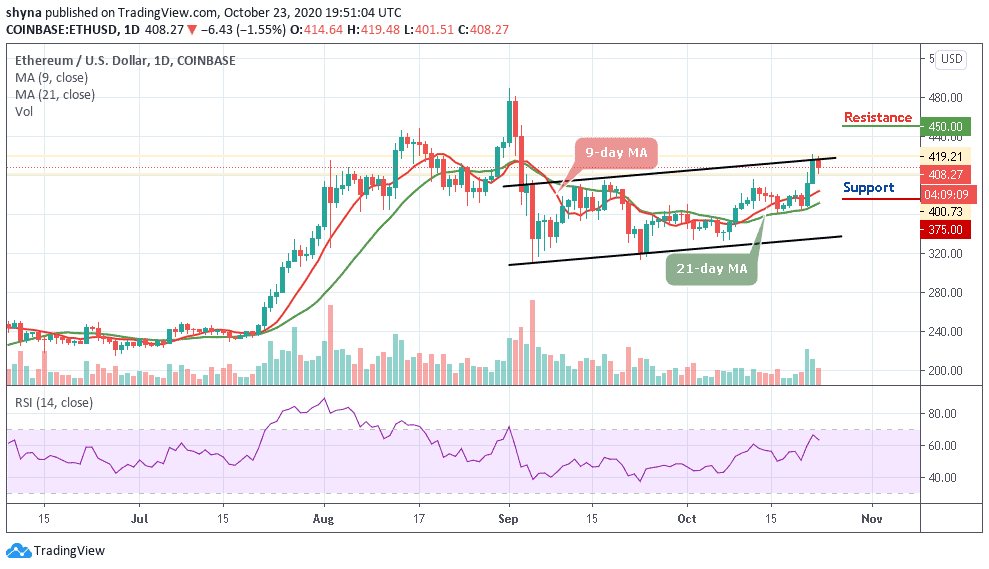
At the time of writing, ETH/USD is trading at $408 where a bearish momentum is building. Looking at the daily chart, the technical indicator RSI (14) shows that the bearish 60-level momentum may be coming into focus after nose-diving below 67-level. However, the 9-day and 21-day moving averages are still visible, suggesting buyers have the ability to regain control.
What is the Next Direction for Ethereum?
At the time of writing, the Ethereum price remains above the moving averages around the upper boundary of the channel. However, the sustainable move above $420 may improve the immediate technical picture and allow for an extended recovery towards the psychological $440. Similarly, any further bullish movement could negate the bearish scenario and bring the resistance of $450, $460, and $470 levels into view.
Meanwhile, the RSI (14) on the daily chart points downwards, signaling that strong upside momentum is less likely at this stage. Meanwhile, a failure to regain the ground could worsen the technical picture and lay the ground for the further sell-off towards psychological support created by $390. This barrier is reinforced by the 9-day MA and has the potential to slow down the bears. Any further bearish movement could be located at $375, $365, and $355 support levels.
Against Bitcoin, the market price remains within the descending channel are the bears are dominating the market. More so, ETH/BTC is currently trading at 0.0316 BTC and the bulls couldn’t push the price to cross above the 9-day and 21-day moving averages. Looking at the chart, if the market continues to drop, the next key supports may likely be at 0.0290 BTC and below.
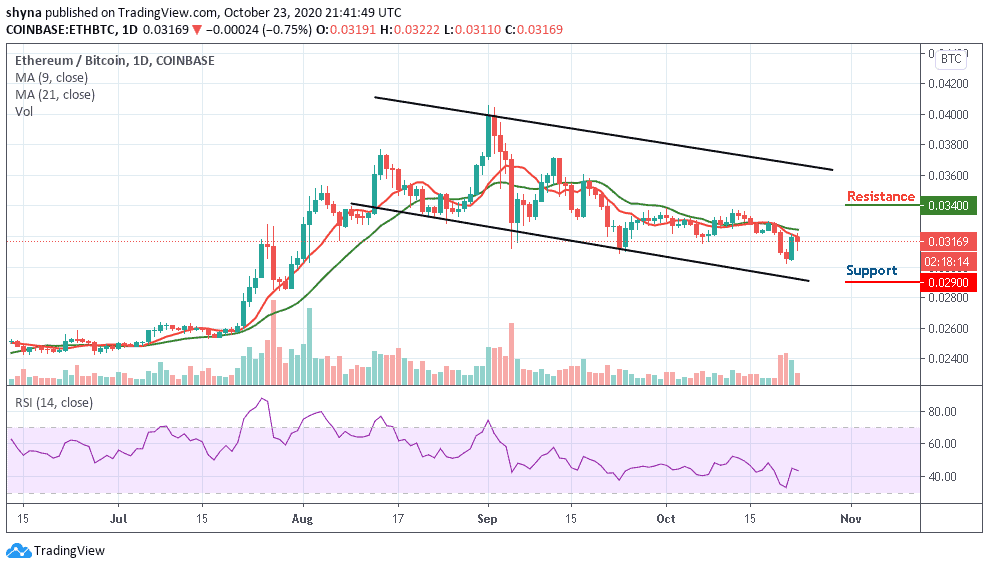
However, on the upside, a possible bullish movement may likely push the market above the moving averages, immediately after this, the resistance level of 0.0340 BTC and above could be visited. Meanwhile, the technical indicator RSI (14) is moving below the 45-level and this is suggesting that the market may continue to drop.
Join Our Telegram channel to stay up to date on breaking news coverage