Join Our Telegram channel to stay up to date on breaking news coverage
Bitcoin (BTC) Price Prediction – October 22
The Bitcoin price paces upwards, trading new 2020 highs above $13,000.
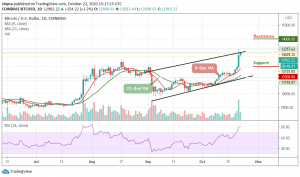
BTC/USD Long-term Trend: Bullish (Daily Chart)
Key levels:
Resistance Levels: $14,000, $14,200, $14,400
Support Levels: $12,000, $11,800, $11,600

In the past few days, BTC/USD has been having a smooth sailing, first bringing down the resistance at $11,800 and the bullish momentum paced upwards, allowing the bulls to smash through the crucial $12,000 level yesterday. Moreover, the bullish leg did not stop here but soared to trade new yearly highs at $13,250. However, if the coin keeps above $13,000 and the volume increases, then traders would confirm Bitcoin finally broke out.
What is the Next Direction for Bitcoin?
As the Bitcoin price continues to move above the 9-day and 21-day moving averages, the bulls may have to show higher volumes that could allow the king coin to break above the $13,250 resistance level which is Bitcoin’s previous high that was registered yesterday. However, if BTC/USD surpasses this level, then, the next possible target would be $13,500, before reaching the potential resistance levels at $14,000, $14,200, and $14,400.
Meanwhile, BTC/USD is currently hovering at $12,962 as the technical indicator RSI (14) remains within the overbought region. More so, if the bulls fail to move the Bitcoin price higher or sustain this level, traders may see a retracement taking the coin below $12,500 once again. Therefore, any bearish movement below the moving averages could drag the coin to the supports of $12,000, $11,800, and $11,600 respectively.
BTC/USD Medium – Term Trend: Bullish (4H Chart)
The 4-hour chart reveals that a minor retreat has seen the flagship retreat under $13,000. Meanwhile, BTC/USD is doddering at $12,946 amid a building bullish momentum. However, looking at the technical indicator RSI (14), buyers appear to be sitting comfortably in the cockpit, ready to push the throttle forward again.
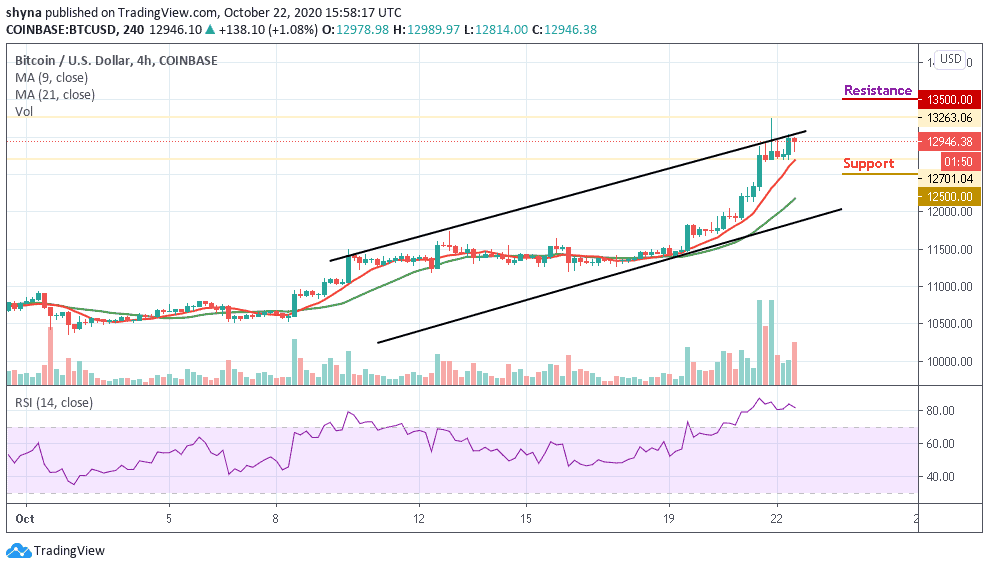
However, as the buyers continue to strengthen the market, the Bitcoin price could reach the nearest resistance at $13,300. Therefore, breaking the mentioned resistance could push the coin to $13,500 and above. Meanwhile, the RSI (14) moves within the overbought zone and any bearish movement below the 9-day MA could drag the price back to the supports of $12,500 and below.
Join Our Telegram channel to stay up to date on breaking news coverage