Join Our Telegram channel to stay up to date on breaking news coverage
Bitcoin (BTC) Price Prediction – October 18
After some brief consolidation, BTC/USD is currently trading above $11,450.
BTC/USD Long-term Trend: Bullish (Daily Chart)
Key levels:
Resistance Levels: $11,900, $12,100, $12,300
Support Levels: $11,100, $10,900, $10,700
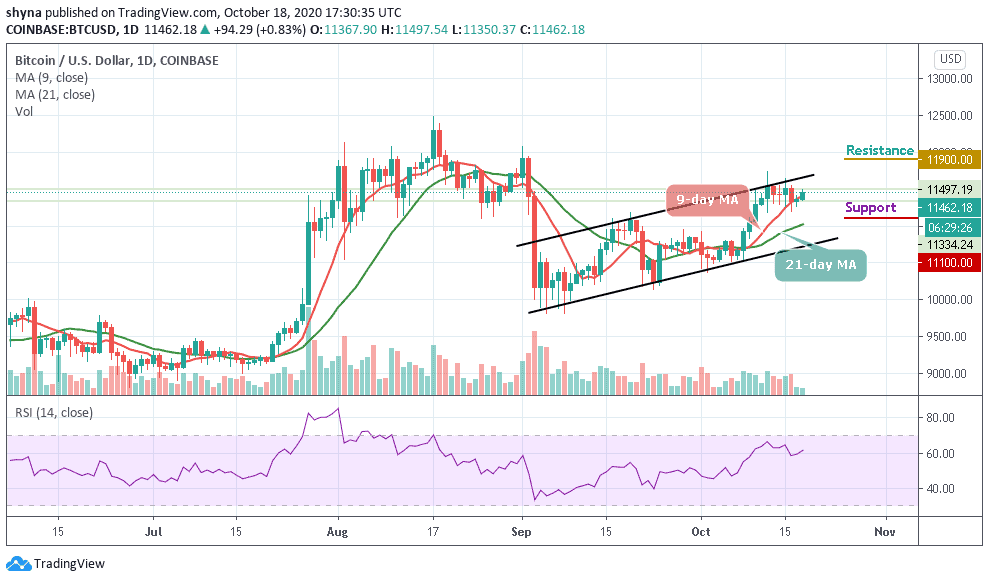
BTC/USD bulls are focusing on breaking the resistance at $11,500; a move that would pave the way for gains above $12,000. The coin is currently settling above $11,400 while the further recovery is limited by the local resistance of $11,300. However, the recent dip that occurred a few days ago was actually helpful for Bitcoin as the technical indicator RSI (14) moves above 60-level as the coin is getting ready for the next leg up.
What to Expect from Bitcoin (BTC)
The Bitcoin price remains in consolidation in spite of a breakout above the 9-day moving average. The bulls are establishing a higher low but only need to climb above $11,500 to confirm a daily uptrend. Presently, the trend is in the favor of the bulls and if the situation remains unchanged, BTC/USD may continue to grind north.
However, the Bitcoin price is currently surpassing the 9-day and 21-day moving averages with the horizontal resistance at $11,462. Any further bullish movement above it may fuel the continuation of $11,700 and the psychological level of $11,800. There is a chance that a new path to $11,900, $12,100, and $12,300 resistance levels may be created.
For now, all the attention should go towards overcoming the hurdle at $12,000 and defending support at $11,200. Meanwhile, going below $11,200 may likely seek supports at $11,100, $10,900, and $10,700 respectively.
BTC/USD Medium-Term Trend: Ranging (4H Chart)
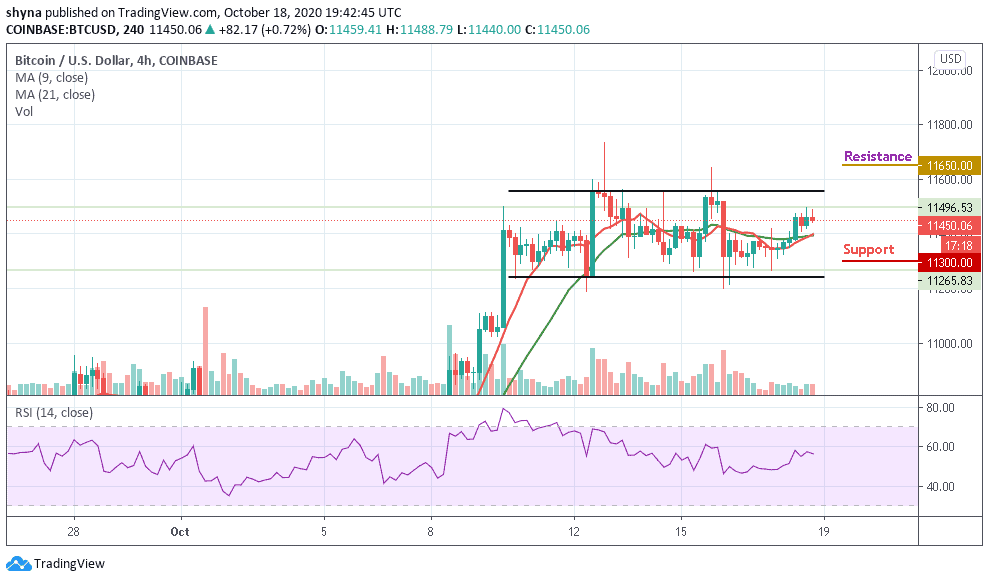
On the 4-hour chart, BTC/USD is seen following a sideways movement since October 10, the coin is currently trading above the 9-day and 21-day moving averages. Meanwhile, the Bitcoin price may follow the upward movement if the technical indicator RSI (14) remains above the 55-level. The potential resistance is located above the upper boundary of the channel at $11,650 and above while the support levels may be found below the moving averages at $11,300 and below.
Join Our Telegram channel to stay up to date on breaking news coverage