Join Our Telegram channel to stay up to date on breaking news coverage
Bitcoin (BTC) Price Prediction – October 17
BTC/USD may stop short of $11,250 as this level is guarded by strong technical barriers.
BTC/USD Long-term Trend: Bullish (Daily Chart)
Key levels:
Resistance Levels: $11,700, $11,900, $12,100
Support Levels: $11,000, $10,800, $10,600
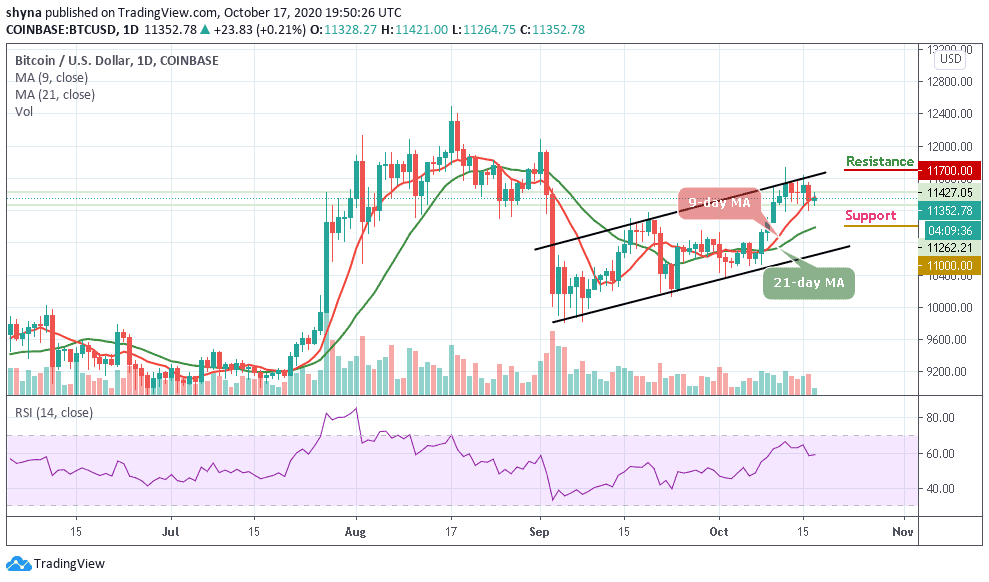
BTC/USD hovers around $11,352 but fails to break above the 9-day moving average and $11,500 resistance. The first digital coin has gained about 0.21% in recent 24 hours and stayed unchanged since the beginning of the day. Meanwhile, the coin remains in the hands of the bulls above $11,000 but must rise above $11,500 to escape the danger zone.
Where is BTC Price Going Next?
If the bulls can successfully push the price above the channel, the next resistance levels may be found at $11,700, $11,900, and $12,100. For now, BTC/USD is trading at $11,352 while pushing for gains towards the short term resistance at $11,400. On the downside, the critical support is created at a psychological $11,250. The price touched this barrier during early Asian hours and recovered swiftly above this level. Once it is out of the way, the sell-off is likely to gain traction with the next focus on $11,200 and $11,100. However, any further low drive could send the price to $11,000, $10,800, and $10,600 supports.
BTC/USD Medium – Term Trend: Ranging (4H Chart)
BTC/USD trades within the range of $11,240 to $11,560. Nevertheless, Bitcoin has not yet slipped below $11,200 and is still in the loop of making a bounce back. BTC price hovers around $11,333 and may take time to persistently trade above $11,400. The upward movement is facing hurdles near the $10,500 and $10,700 resistance level.
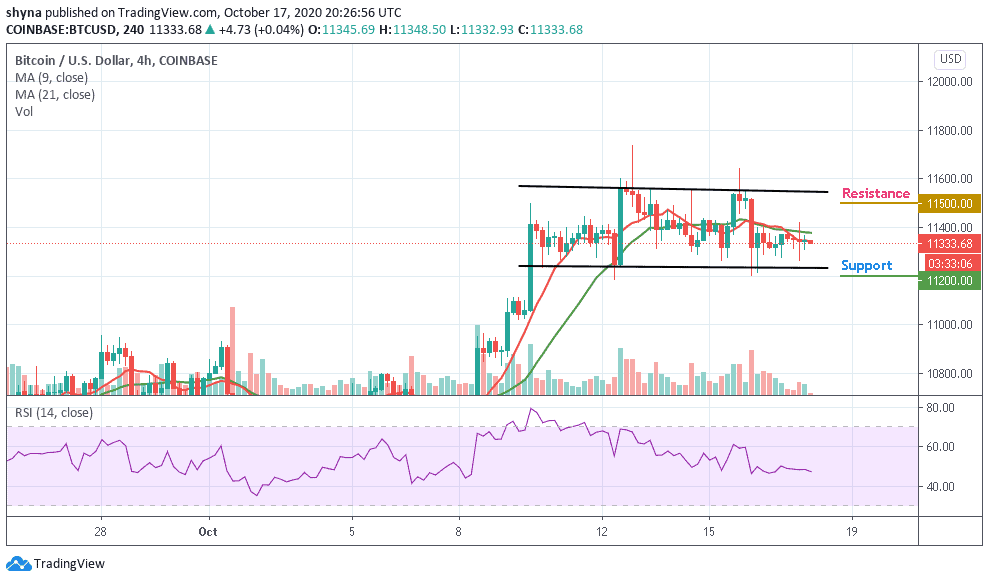
On the downside, immediate support is near the $11,300 level while the main support is at the $11,250 level. The price might slide below $11,200 which may likely test another support at the $11,000 level. Technically, Bitcoin is currently moving in sideways while the RSI (14) moves around 47-level, indicating indecisive market movement.
Join Our Telegram channel to stay up to date on breaking news coverage