Join Our Telegram channel to stay up to date on breaking news coverage
Bitcoin (BTC) Price Prediction – October 16
The Bitcoin price struggles and faced rejection after touching the daily high of $11,550 resistance level.
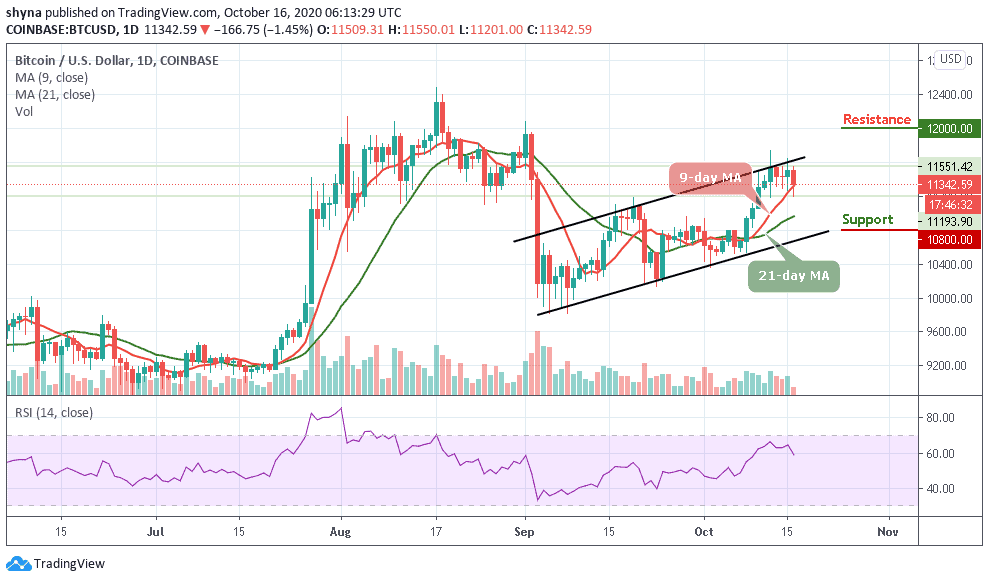
BTC/USD Long-term Trend: Bullish (Daily Chart)
Key levels:
Resistance Levels: $12,000, $12,200, $12,400
Support Levels: $10,800, $10,600, $10,400
It is very important for BTC/USD to reclaim the ground above $11,500 as soon as possible, the reason being that more action is expected above this level. However, the longer Bitcoin (BTC) stays under $11,500, the stronger the bears get and this may result in such that the support at $11,000 may not be enough to hold the intense pressure. In this case, the Bitcoin (BTC) could now refresh lows towards $10,900 support.
What is the Next Direction for Bitcoin?
Looking at the daily chart, it is likely for consolidation to take precedence with support at $11,200, holding well. The technical indicator RSI (14) also puts emphasis on the possible downtrend action as the signal line is seen crossing below 60-level. But the moving averages are showing different signals as the red-line of 9-day MA is still above the green-line of 21-MA, meaning that the bulls are still in control.
The next few days could be extremely crucial for Bitcoin’s price. If BTC price fails to break below the moving averages, the market price may likely move back below the $11,000 level or it may just sit between the $11,200 – $11,400 price range. However, the resistance levels to keep eye on are $12,000, $12,200, and $12,400 while the supports are located at $10,800, $10,600, and $10,400 respectively
BTC/USD Medium – Term Trend: Ranging (4H Chart)
According to the 4-hour chart, BTC/USD is seen on a downward move and the coin may continue to depreciate if the $11,200 support is broken. The 9-day MA is seen crossing below the 21-day MA, once this is done, BTC/USD may likely fall and could reach the critical supports at $11,100, $10,900, and $10,700 respectively.
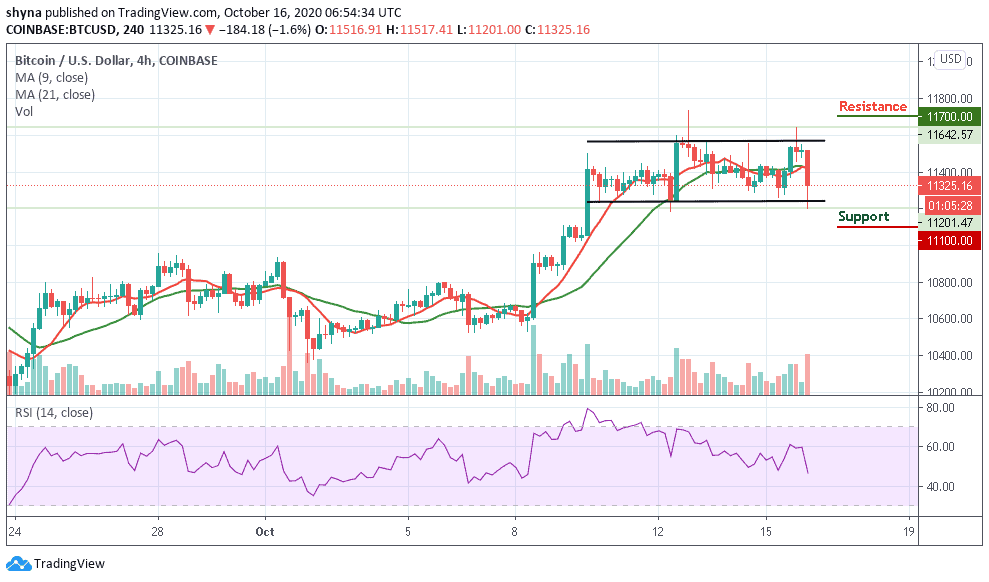
However, if the bulls can hold the current price tight, BTC/USD may likely cross back above the moving averages, breaking above the upper boundary of the channel may push it to the potential resistance at $11,700, $11,900, and $12,100 levels. Meanwhile, the technical indicator RSI (14) is currently facing the south, suggesting more bearish signals into the market.
Join Our Telegram channel to stay up to date on breaking news coverage