Join Our Telegram channel to stay up to date on breaking news coverage
Bitcoin (BTC) Price Prediction – October 12
The Bitcoin (BTC) is moving confidently above $11,500 as the bulls now focus on the potential $12,000 resistance.
BTC/USD Long-term Trend: Bullish (Daily Chart)
Key levels:
Resistance Levels: $12,000, $12,200, $12,400
Support Levels: $10,900, $10,700, $10,500
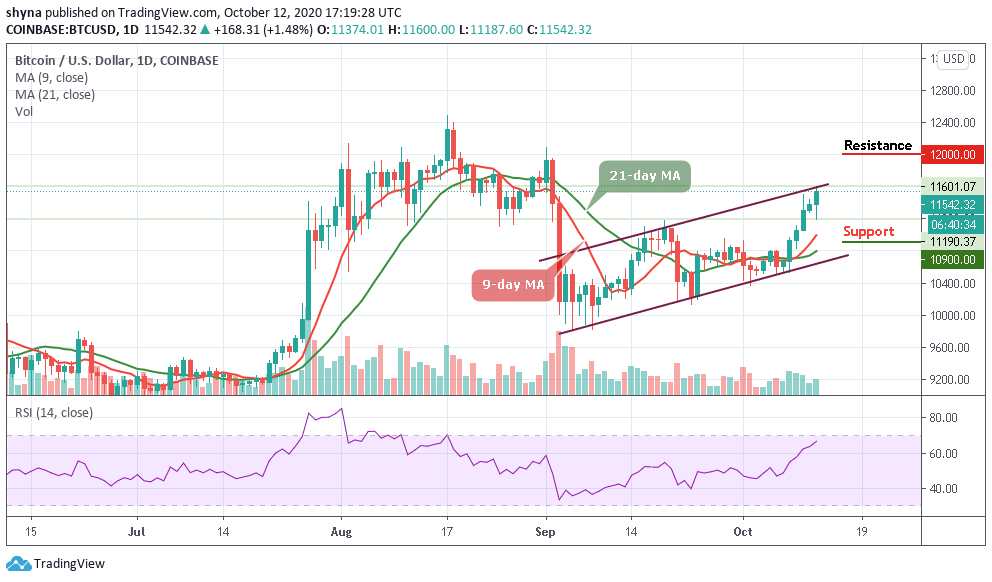
After a weekend rally, BTC/USD fell sharply this morning to start off the new week. Immediately after touching the low $11,187, the number one cryptocurrency starts rocketing higher above the 9-day and 21-day moving averages to touch a daily high of $11,600 where the bulls are now attempting to hold strong if the coin remains above the moving averages.
What to Expect from Bitcoin (BTC)
According to the daily chart, it is important for BTC/USD to remain above $11,500. However, if the coin is rejected here, a retest of $10,000 support could be next. Meanwhile, after six successful bullish days, the bears may not let the support level of $11,000 to survive if the price action returns. Nevertheless, we can see that the price is currently hovering at $11,452 near the upper boundary of the channel. This is a critical area for BTC to hold above and cross the upper channel if the bulls manage to maintain their current momentum into the close.
As things stand now, the next important resistance level may be at $11,800 and this will undoubtedly be an area of high selling pressure as BTC/USD approaches the psychological, all-important $12,000 level, it may need a considerable trading volume to the additional resistance levels at $12,200 and $12,400 as the RSI (14) is moving towards the overbought region. In other words, any bearish movement could lead the cryptocurrency to the support levels of $10,900, $10,700, and $10,500.
BTC/USD Medium-term Trend: Bullish (4H Chart)
Looking at the 4-hour chart, BTC/USD is currently trading around $11,574 and above the 9-day and 21-day moving averages after a reversal from $11,187 that occurs today. However, the 4-hour chart shows that the bullish supply is now heavy in the market as the bears couldn’t bring the price down.

Moreover, if the buyers continue to strengthen and energize the market, they can further push the price to a $11,750 resistance level. Therefore, breaking the mentioned resistance may likely allow the bulls to touch the $11,850 and above. In other words, the RSI (14) is currently moving within the overbought region, but when it turns down; the bears could bring the price to the supports of $11,300 and below.
Join Our Telegram channel to stay up to date on breaking news coverage