Join Our Telegram channel to stay up to date on breaking news coverage
Bitcoin (BTC) Price Prediction – August 19
Bitcoin (BTC) is seeing a glimpse of hope today with a decent 0.40% price increase climbing above $11,800.
BTC/USD Long-term Trend: Bullish (Daily Chart)
Key levels:
Resistance Levels: $12,600, $12,800, $13,000
Support Levels: $11,000, $10,800, $10,600

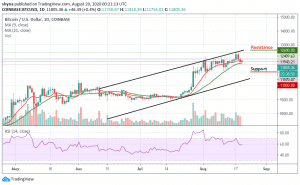
BTC/USD is trading at $11,805 after a significant rejection from $12,409 a few days ago. Bears have not gotten a lot of continuation just yet as Bitcoin is seeing some support from the daily below the 9-day moving average at $11,733. More so, Bitcoin bulls are hoping to defend the daily 9-day MA and to bounce back up above $12,000.
Would Bitcoin (BTC) Go up or Down?
In spite of the hurdle at $11,800 and the on-going rebounds, all is not lost for the bulls because the technical indicator is holding within the positive region and the signal line is about to cross above the 60-level once again. Besides, bulls have eyes on the prize at $12,000 and, therefore, will not relent in the push for gains above this crucial level.
However, the Bitcoin bulls need to see a strong move and continuation towards the crucial resistance level of $12,000 to be confident in the short-term. The last low of the daily uptrend is $11,733, which could act as a support level. On the other hand, if the daily price closes above $12,200, a movement to $12,600, $12,800, and $13,000 resistance levels may likely come into focus, else the coin might drop below the moving averages to see the critical supports at $11,000, $10,800, and $10,600 respectively.
BTC/USD Medium-Term Trend: Bullish (4H Chart)
Looking at the 4-hour chart, BTC/USD is currently moving around $11,818 below the 9-day and 21-day moving averages after a rebound from $11,572. Meanwhile, the 4-hour chart reveals that the bullish supply is coming up slowly in the market while the bears are also trying to drag the price down.
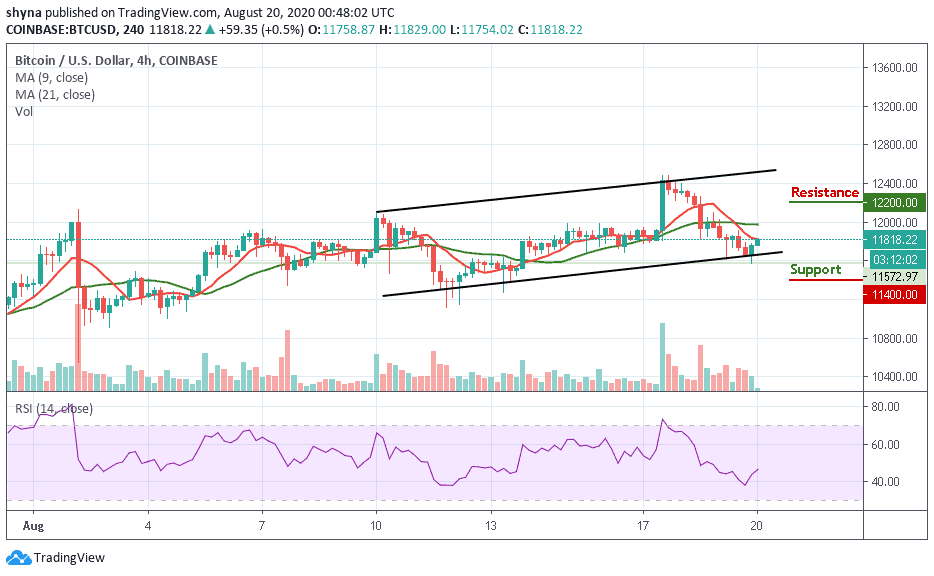
If the buyers could put more effort, they can further push the price above the moving averages. Therefore, breaking this barrier could test the resistance level of $12,200 and above. More so, the RSI (14) is seen recovery above 45-level, any bearish movements may drag the coin to the supports at $11,400 and below.
Join Our Telegram channel to stay up to date on breaking news coverage