Join Our Telegram channel to stay up to date on breaking news coverage
Bitcoin (BTC) Price Prediction – April 23
The Bitcoin price is down by 4.55% as the entire crypto market is in the red today while a sharp spike lower was seen across the board.
BTC/USD Long-term Trend: Ranging (Daily Chart)
Key levels:
Resistance Levels: $57,000, $59,000, $61,000
Support Levels: $43,000, $41,000, $39,000
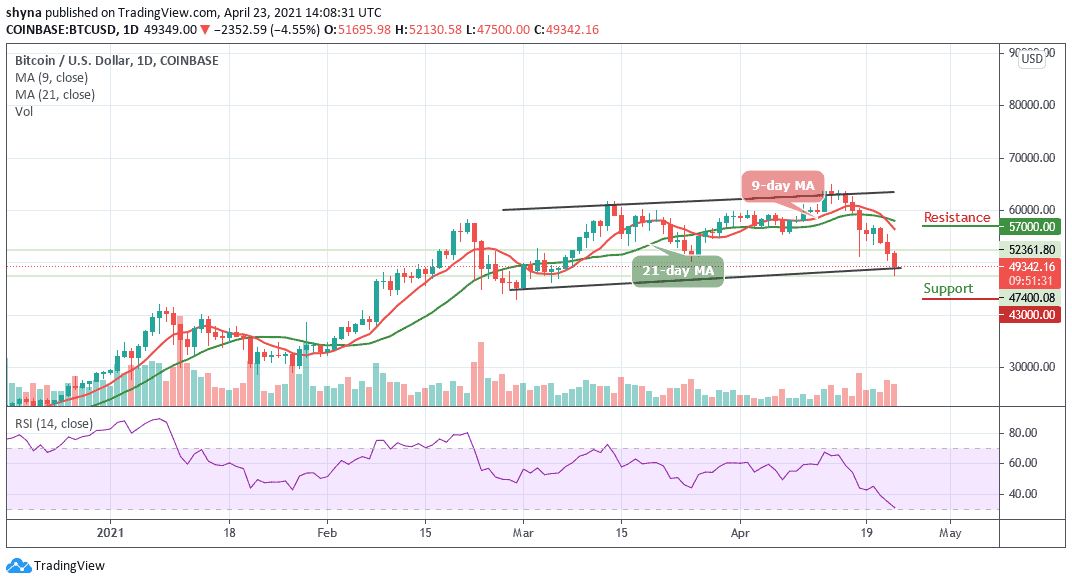
On April 14, BTC/USD was seen trading around the resistance level of $64,899, but a failure to hold above the key resistance level sent the cryptocurrency tumbling. In the last few days, the first digital asset fell below $48,000 for the first time in this month but is it possible for bulls to hold this important support?
What to Expect from Bitcoin (BTC)
The last trip to the $65,000 level could be the last for some time, now that the Bitcoin (BTC) is trading at $49,342 sliding towards the lower boundary of the channel. However, if the market continues to go down, Bitcoin’s price may drop to $45,500, and should this support fails to contain the sell-off, traders may see a further drop to $43,000, $41,800, and critically $39,000 supports.
Meanwhile, if the market price decides to create a new upward movement, it may likely hit the resistance levels at $57,000, $59,000, and $61,000 respectively. Meanwhile, the RSI (14) is likely to cross into the overbought region, suggesting that more bearish signals may play out in the market.
BTC/USD Medium – Term Trend: Bearish (4H Chart)
On the 4-hour chart, the BTC price has failed to reach the $47,000 support as some upside momentum took over the Bitcoin price momentum. However, traders could see further downside later today before a much substantial retracement to the upside is seen over the weekend. The resistance level are located at $54,000 and above while the technical indicator RSI (14) remains below 35-level.
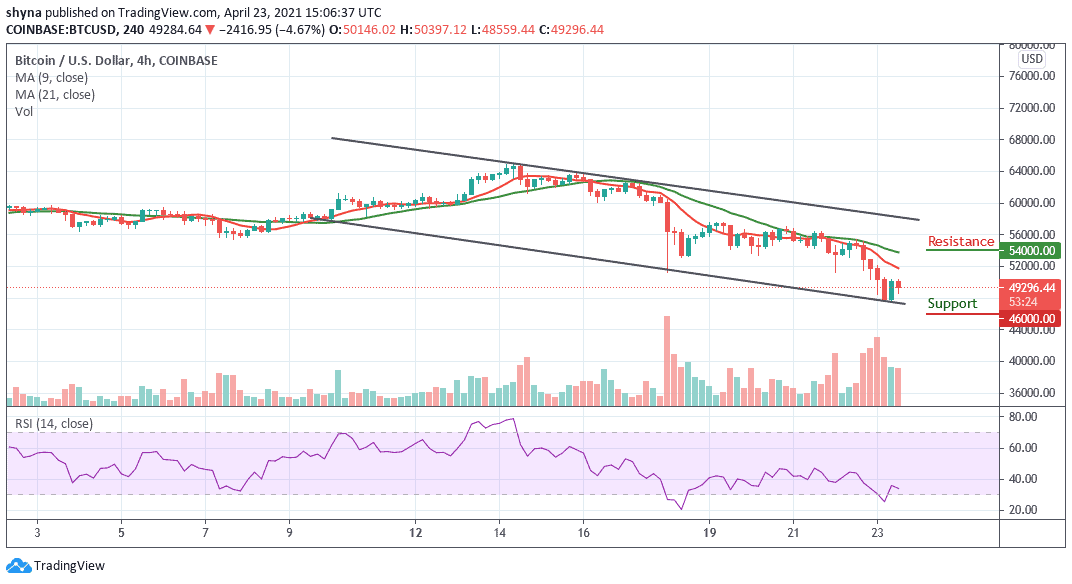
As mentioned before, the market sets another lower low below $48,000, yesterday after a quick spike to retest the $51,500 support. From there, BTC/USD started moving lower in the afternoon until the $51,500 support was broken with only a slight hesitation. The bearish momentum continued overnight, resulting in a new lower low set at 47,500.
However, the Bitcoin price has lost over 25% from the previous all-time high, just below the $65,000. As two strong bearish waves to the downside have been made, traders could see the Bitcoin price action shift later this month as the price could slide to the support of $46,000 and below.
Join Our Telegram channel to stay up to date on breaking news coverage