Join Our Telegram channel to stay up to date on breaking news coverage
Bitcoin (BTC) Price Prediction – April 19
The price of Bitcoin rebounds above $56,000, despite the pressure from the sellers.
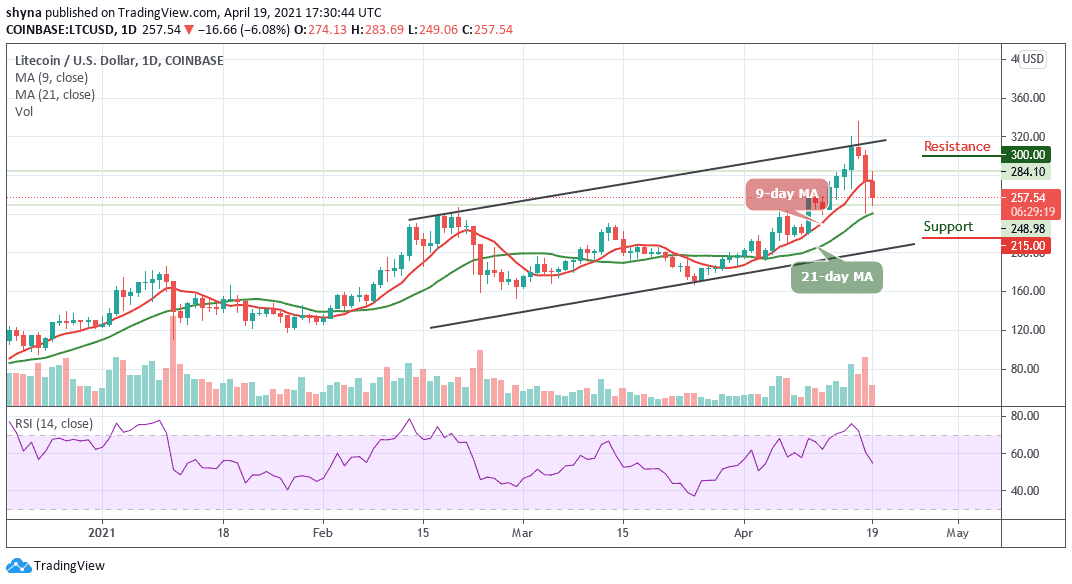
BTC/USD Long-term Trend: Bullish (Daily Chart)
Key levels:
Resistance Levels: $62,000, $64,000, $66,000
Support Levels: $50,000, $48,000, $46,000

BTC/USD keeps turning heads with its majestic rise to highs above the previous level of $56,273. However, the BTC price could not stay up for long because of an immediate reversal in the market. In the early hours of today, BTC/USD held on to the support above $54,000 but the market still remains below the 9-day and 21-day moving averages.
Possible Next Direction for BTC/USD
The Bitcoin price remains in the consolidation mode below the moving averages, deciding on the next move. However, it can be expected that the market may continue to sell should in case the coin break below the lower boundary of the channel. Therefore, if the bulls begin to show a strong commitment, BTC/USD could rise above the moving averages and may reach the potential resistance levels of $62,000, $64,000, and $66,000 while the RSI (14) indicator faces the south, may continue to give bearish signals.
Nevertheless, the daily chart shows that the weak upward momentum may be affecting the Bitcoin bulls, although bears may continue to keep the price below the moving averages which could lead the Bitcoin price to the supports of $50,000, $48,000, and $46,000 in the next negative moves.
BTC/USD Medium-Term Trend: Bearish (4H Chart)
Bitcoin’s price is now trading around $56,172 after touching the high of $57,412. Looking at the 4-hour price chart, traders can see that bulls are dragging the price above the 9-day moving average. Meanwhile, the $60,000 resistance level and above may come into play if BTC breaks the upper boundary of the channel.
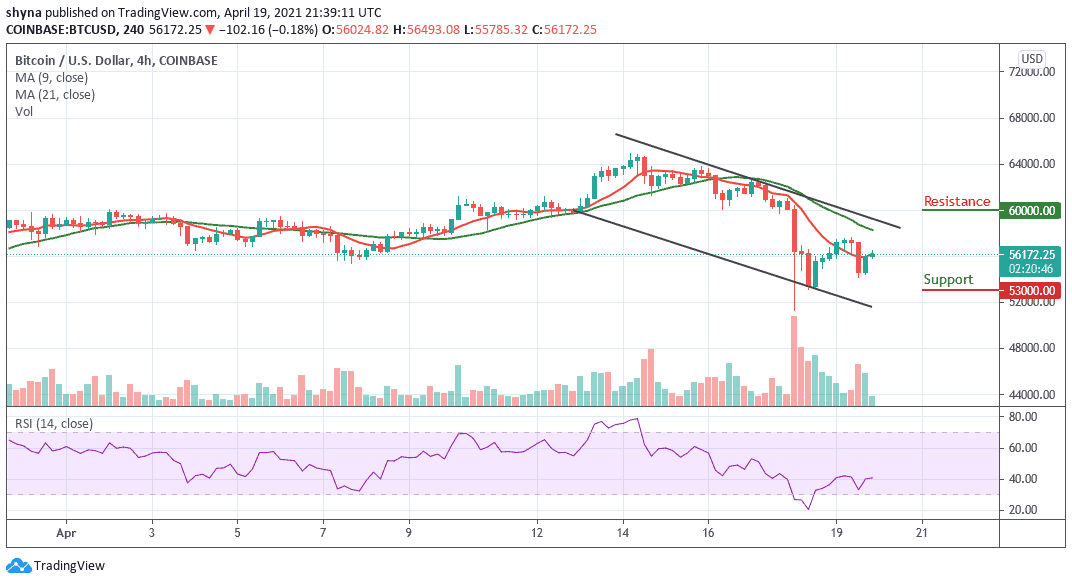
However, if the sellers bring the market price below the moving averages, the coin is expected to retest the $54,500 support level. Therefore, breaking the mentioned barrier may drag the king coin to the support level of $53,000 and above. However, BTC/USD is consolidating and could be moving sideways on the medium-term outlook as the RSI (14) moves above the 40-level.
Join Our Telegram channel to stay up to date on breaking news coverage