Join Our Telegram channel to stay up to date on breaking news coverage
Bitcoin (BTC) Price Prediction – April 12
BTC/USD is seen moving under $60,000 amid the struggle to extend the bullish leg above $61,000.
BTC/USD Long-term Trend: Bullish (Daily Chart)
Key levels:
Resistance Levels: $64,000, $66,000, $68,000
Support Levels: $56,000, $54,000, $52,000
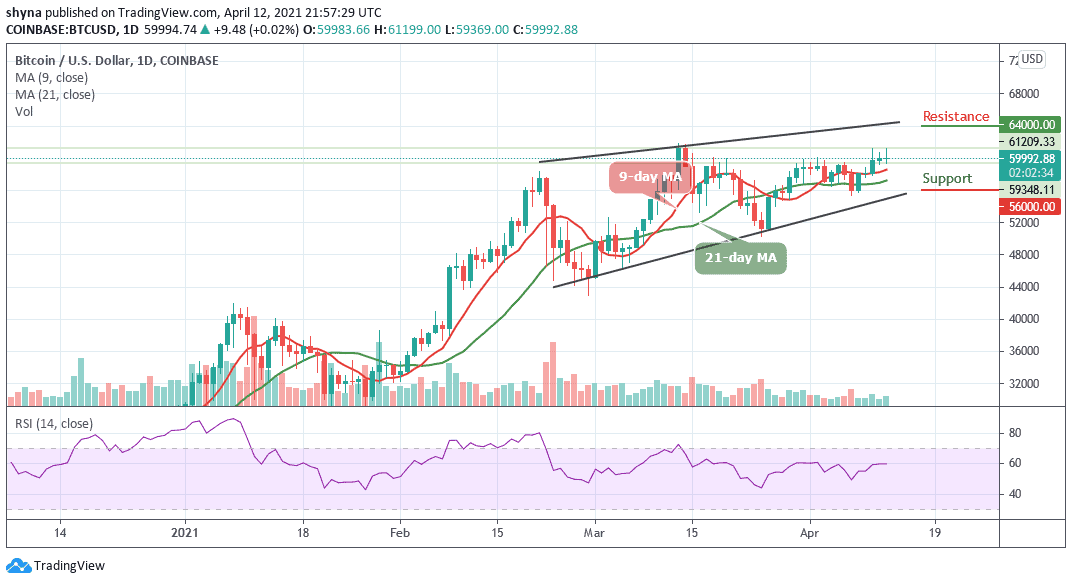
BTC/USD has been able to touch the daily high of $61,199. Presently, the Bitcoin price is seen trading below the $60,000 level as the coin finds its way back towards the 9-day and 21-day moving averages. Initially, trading above $60,000 has been an uphill battle for the coin, while most of the price actions above $60,000 stalled around this level.
Where is BTC Price Going Next?
According to the daily chart, the break above $62,000 is going to be a big step for bulls as this will allow them to expand their scope above $61,000 which has always been a restriction for the coin. However, Traders should note that BTC/USD is still very much above the moving averages, which could still bring massively bullish signals for the market. But if the price should slump below the moving averages, the $56,500 level could be an important zone to keep an eye on. Once bulls flip this level into support, the next major supports for the world’s leading crypto could be $56,000, $54,000, and $52,000.
Moreover, as the king coin continues to hover around the $60,000 zone, there are two crucial price levels to pay attention to. The underlying support at $59,000 and the overhead resistance at $62,000 will help determine where prices are headed next as the potential resistance levels are located at $64,000, $66,000, and $68,000. Meanwhile, the technical indicator RSI (14) suggests a sideways movement as the signal line moves around 60-level.
BTC/USD Medium-Term Trend: Ranging (4H Chart)
According to the 4-hour chart, BTC/USD needs to remain above the 9-day and 21-day moving averages to mitigate the short-term bullish pressure and allow for an extended recovery towards $60,000. In addition, a higher resistance level may be found at $62,000 and above.
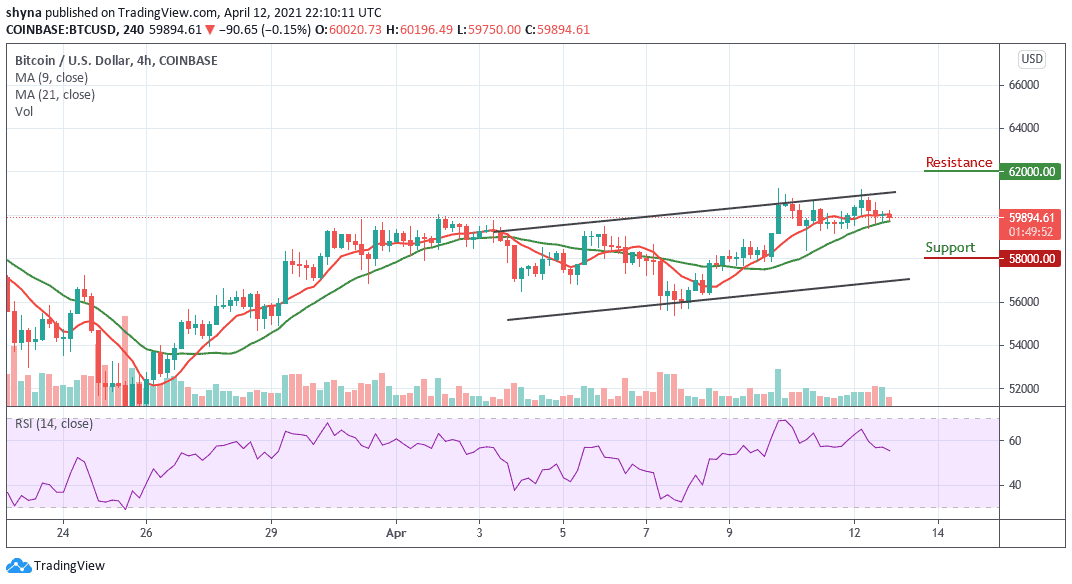
On the other hand, the nearest support is below the moving averages at $59,000, and a critical move below this level may increase the downside pressure to the support level of $58,000 and below. Meanwhile, the technical indicator RSI (14) is staring at the downward movement as the signal line moves below the 56-level.
Join Our Telegram channel to stay up to date on breaking news coverage