Join Our Telegram channel to stay up to date on breaking news coverage
Bitcoin (BTC) Price Prediction – April 7
The first digital asset has been facing some immense selling pressure as of late, with the support found within the $55,400 level.
BTC/USD Long-term Trend: Bullish (Daily Chart)
Key levels:
Resistance Levels: $62,000, $64,000, $66,000
Support Levels: $52,000, $50,000, $48,000

BTC/USD has been struggling to maintain its uptrend, with the selling pressure found below the 9-day and 21-day moving averages which are stopping it from seeing any major gains throughout the past few days. Meanwhile, traders are not surprised by the selling pressure as bears are trying to defend against a break above the cryptocurrency’s all-time highs.
Where is BTC Price Going Next?
At the time of writing, BTC/USD is trading down just under 2.87% at its current price of $56,355. This marks a climb from its daily low of $55,400 set at the bottom of the decline. However, the coming few days may likely place the market price within the negative side as the technical indicator RSI (14) nosedives to the downside. Therefore, any decline from this level could determine the trend of the first digital asset.
Looking at the daily chart, the Bitcoin (BTC) is currently pushing towards the lower boundary of the channel, with bulls moving to erase the losses that came about at the early hour of today’s trading. Furthermore, any bullish movement above the moving averages may push the price to the resistance level of $62,000, $64,000, and $66,000 while the supports are located at $52,000, $50,000, and $48,000.
BTC/USD Medium – Term Trend: Ranging (4H Chart)
Looking at the 4-hour chart, the resistance at the $56,500 has been too heavy for the bulls to overcome as the price is now struggling in a consolidation mode. This current trading is making the cryptocurrency remain indecisive over the past few hours now while the resistance levels to watch are 58,000 and above.
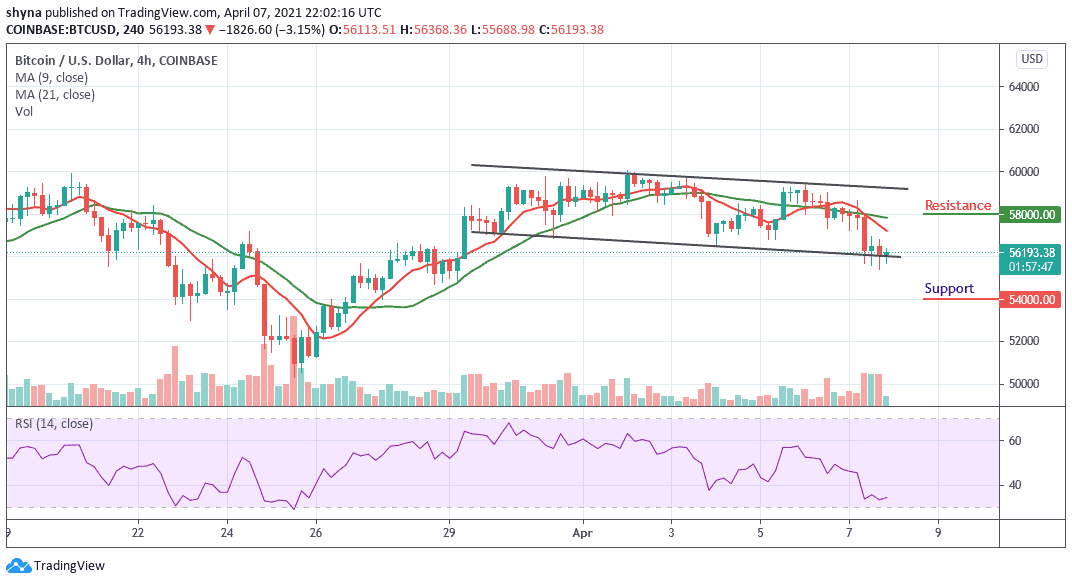
Nevertheless, the coin is still roaming around $56,193 as bears keep the price below the 9-day and 21-day moving averages. Meanwhile, the $54,000 and below may come into play if the technical indicator RSI (14) remains below 35-level.
Join Our Telegram channel to stay up to date on breaking news coverage