Join Our Telegram channel to stay up to date on breaking news coverage
Bitcoin (BTC) Price Prediction – April 6
BTC/USD sees a 2.55% price decline over the past few hours as the cryptocurrency fails at $59,475 and heads lower.
BTC/USD Long-term Trend: Bullish (Daily Chart)
Key levels:
Resistance Levels: $65,000, $67,000, $69,000
Support Levels: $53,000, $51,000, $49,000
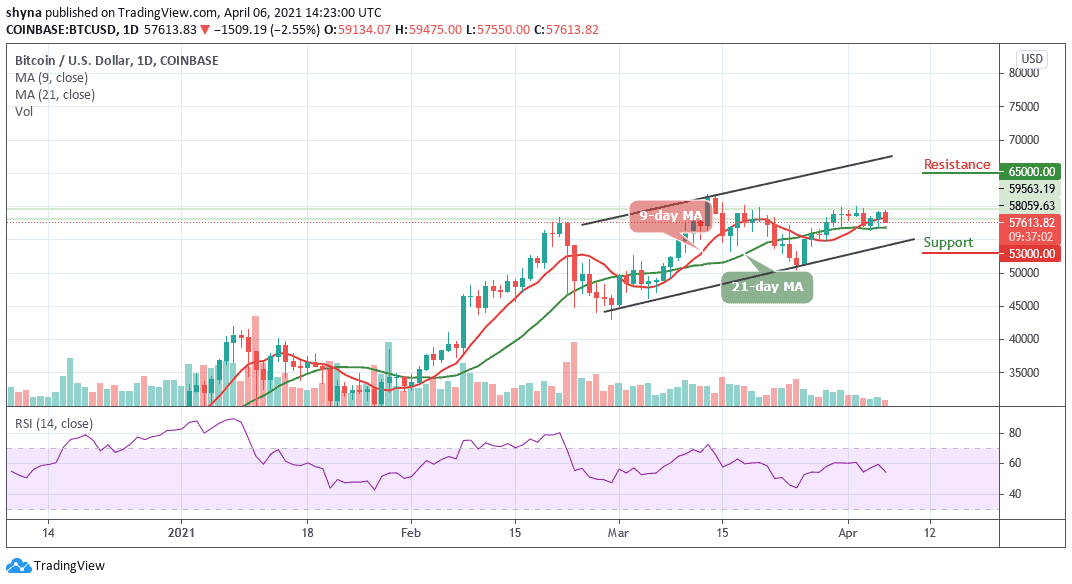
BTC/USD loses its momentum after touching key resistance above $59,000. As of writing, the pair is down 2.55% on the day at $57,613 trading below the 9-day moving average. Meanwhile, looking at the daily chart, Bitcoin may struggle to close above $58,000 and if it does this, it should be free to rise well above $59,000 if it moves in the next positive directions.
What is the Next Direction for Bitcoin?
However, we can see that since yesterday, BTC/USD was unable to close above the resistance at $60,000. The coin has really been struggling to break this region over the past 5-days of trading. Moreover, in today’s session, the coin attempted to push higher as it reached $59,475, but the sellers then step in and start pushing the coin lower to reach the current level at $57,613.82.
Moreover, the $57,000 may serve as the nearest support level, which may likely make room for the coin to fall further with the supports of $53,000, $51,000, and $49,000. The RSI (14) for the coin nosedives below 60-level to indicate a downward movement. Meanwhile, BTC/USD may likely see the resistance levels of $65,000, $67,000, and $69,000 if it finds its way back above the moving averages.
BTC/USD Medium-Term Trend: Ranging (4H Chart)
On the 4-Hour chart, BTC price hovers around $57,862 and may take time to persistently trade above $58,000. More so, if the bulls gather enough strength and regroup, the upward movement may be able to near the $60,000 and $61,000 resistance level.
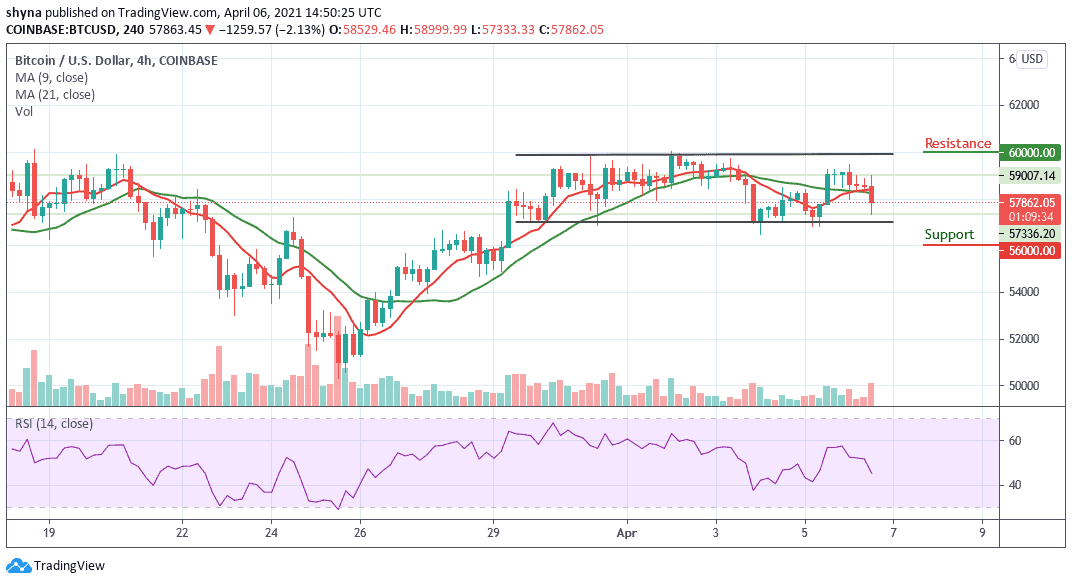
However, on the downside, immediate support is around the $57,500 level while the main support is at the $57,000 level. The price may likely fall below the lower boundary of the channel if the bears step back into the market, a further movement could reach the critical support at the $56,000 level. Technically, BTC/USD is currently moving in sideways while the RSI (14) moves around 50-level, indicating a bearish movement.
Join Our Telegram channel to stay up to date on breaking news coverage