Join Our Telegram channel to stay up to date on breaking news coverage
Bitcoin (BTC) Price Prediction – April 4
Bitcoin continues to fail in overcoming $60,000 as the latest rejection drives the asset to a daily low of $56,500.
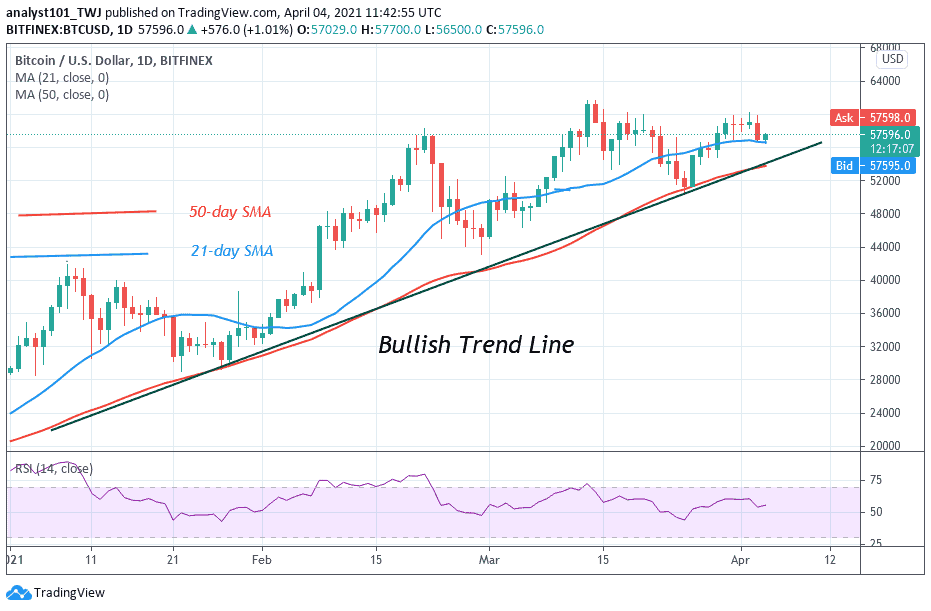
BTC/USD Long-term Trend: Bullish (Daily Chart)
Key levels:
Resistance Levels: $62,000, $64,000, $66,000
Support Levels: $53,000, $51,000, $49,000
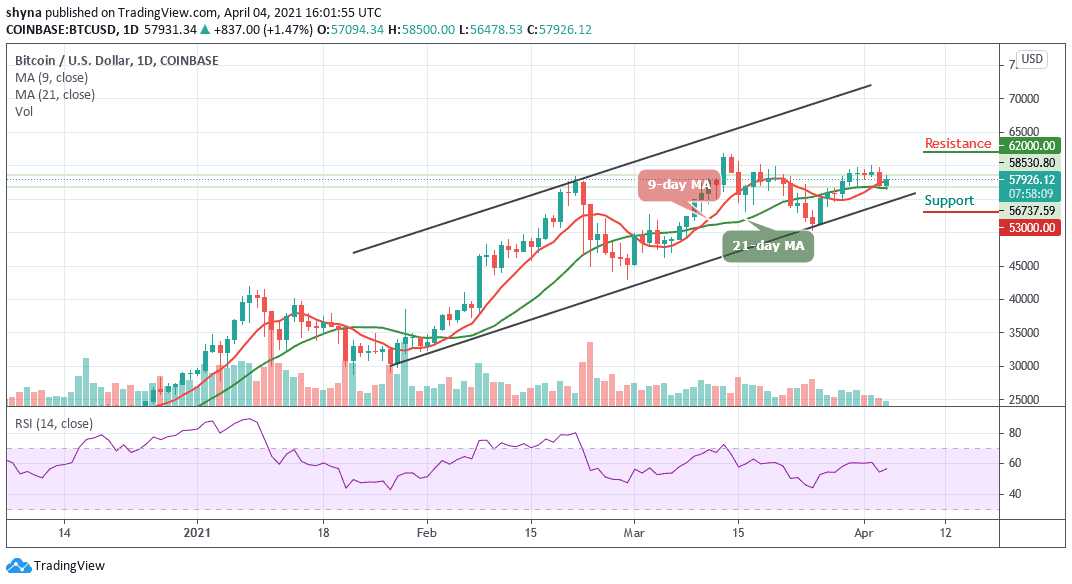
According to the daily chart, BTC/USD is correcting gains from $60,000 and it is likely to start a fresh increase as long as there is no close below $56,500. This past week, the Bitcoin price saw a steady increase above the $58,000 resistance level. Later on, BTC/USD broke the $58,000 resistance and it settled above the 9-day and 21-day moving averages. A high was formed near $60,060 but yesterday the price started a fresh decline.
What to Expect from Bitcoin
BTC/USD is seen retracing and trading around the within moving averages and the market price stays under the daily high of $58,500 resistance as a sign of bullish momentum. Further increase in the bullish momentum may have to increase the price above this level; another resistance may come at $60,000 before reaching the potential resistance of $62,000, $64,000, and $66,000 levels.
However, should the $57,500 resistance level failed to hold, the price may reverse and face the support level at $55,000, further increase in the bears’ pressure may push down the price towards the 21-day moving average and possibly hit the critical supports at $53,000, $51,000, and $49,000. Meanwhile, the technical indicator RSI (14) signal line is moving above 55-level, crossing below it may ignite sell signals into the market.
BTC/USD Medium – Term Trend: Ranging (4H Chart)
According to the 4-hour chart, the fast-moving 9-day MA remains below the slow-moving 21-day MA; the market price is trading below the two moving averages as a sign of bearish momentum. However, in case the current market value of the $58,000 level still holds, the bears may exert pressure to break down the important support level and the price may decline to $56,000 and below.
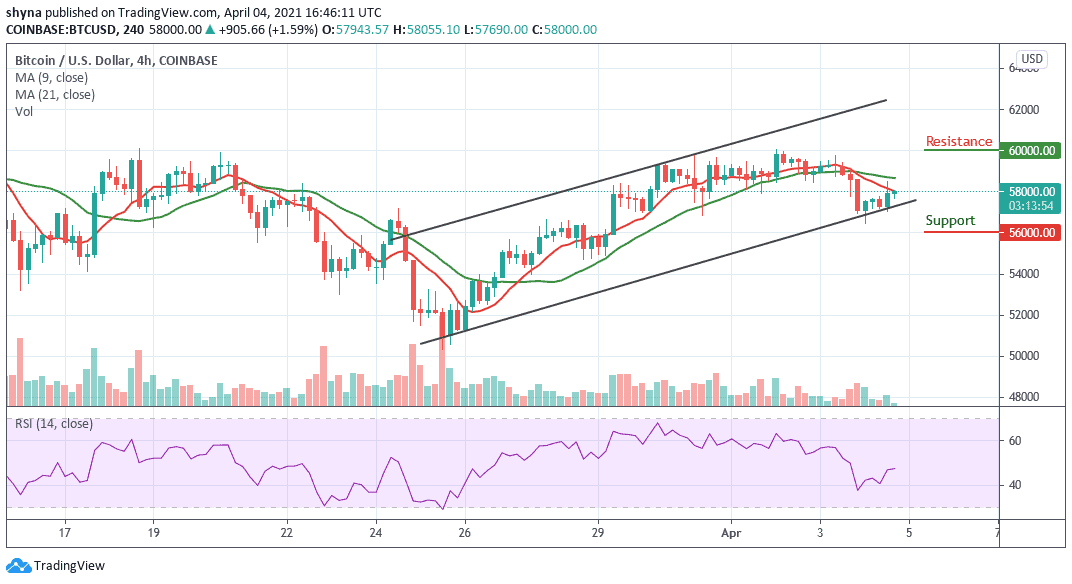
Moreover, should the bulls increase their pressure and push the market price above the moving averages, the resistance level of $59,500 may be penetrated and the price may increase to $60,000 and above. Meanwhile, the technical indicator RSI (14) is moving around 45-level to indicate a sideways movement while crossing below this level may suggest a bearish signal.
Join Our Telegram channel to stay up to date on breaking news coverage