Join Our Telegram channel to stay up to date on breaking news coverage
Bitcoin (BTC) Price Prediction – September 29
For Bitcoin to start moving higher, its price must defend the $10,600 support as if its future performance depends on it.
BTC/USD Long-term Trend: Bullish (Daily Chart)
Key levels:
Resistance Levels: $11,300, $11,500, $11,700
Support Levels: $10,300, $10,100, $9,900

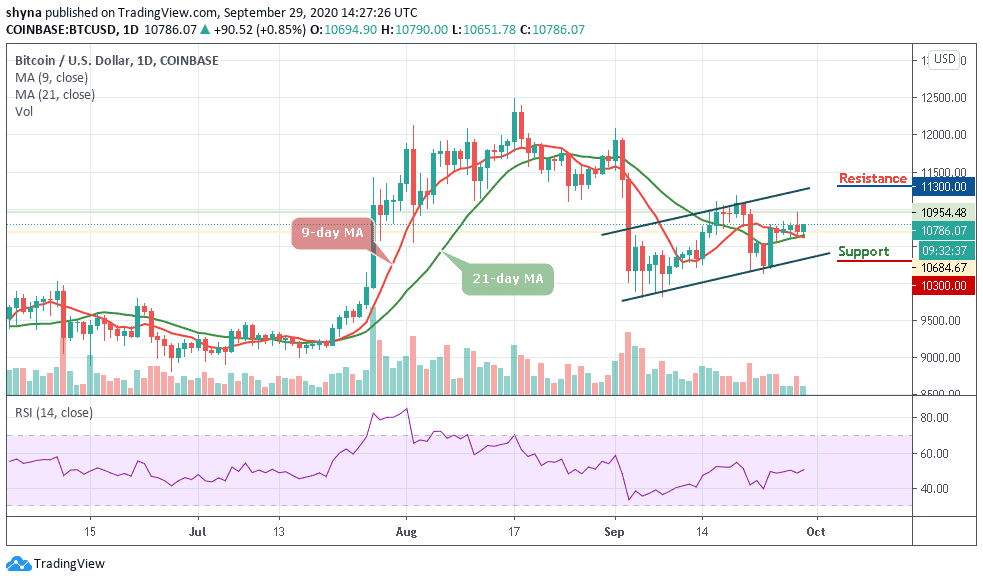
BTC/USD has been struggling to maintain its position above the $10,700 support level and its price saw a dive below the $10,651 mark today during early Asian hours. If the breakthrough is confirmed, the downside momentum may gain traction with the next focus on $10,500. At the time of writing, BTC/USD is trading above the moving averages of 9-day and 21-day at $10,786 with a rise of 0.85% on the daily price chart.
Where is BTC Price Going Next?
BTC/USD is struggling to climb higher above the $10,700 resistance as the coin is settling in a tight range between $10,600 and $10,900 above the 9-day and 21-day moving averages. Typically when the new uptrend movements are beginning to form, buyers may use the moving averages as the nearest support levels. However, in as much as the red-line of the 9-day MA is above the green-line of the 21-day MA, the market could still remain in the upward movement.
Moreover, if the market decides to go down, Bitcoin’s price may drop below the 9-day moving average at $10,600, and should this support fails to contain the sell-off, we may see a further drop to $10,300, $10,100, and critically $9,900. The resistance levels to watch are $11,300, $11,500, and $11,700 respectively. Meanwhile, the RSI (14) signal line is moving in the same direction above 50-level, suggesting a sideways movement.
BTC/USD Medium-Term Trend: Ranging (4H Chart)
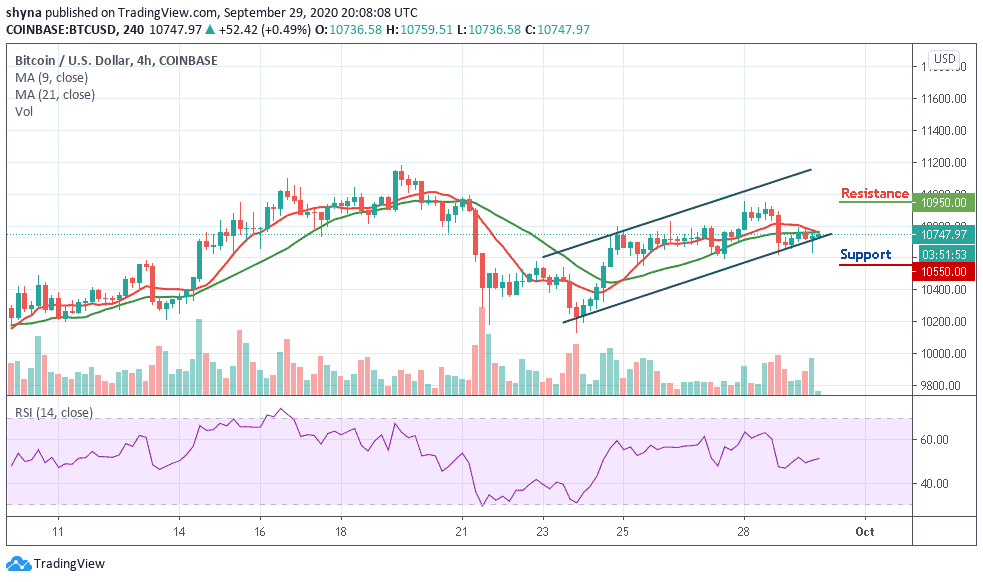
Looking at the 4-hour chart, the bears wanted to step back into the market by bringing the price from $10,790 to $10,636, but the bulls quickly held the support by picking the price from there to where it is currently trading at $10,747 which is below the 9-day and 21-day moving averages. Meanwhile, the $10,950 and above may come into play if BTC/USD breaks above the barrier.

However, if the price breaks below the lower boundary of the channel and begins to fall, the support level of $10,550 and below may be in focus. Meanwhile, as the RSI (14) moves above 50-level, more bullish signals may likely play out.
Join Our Telegram channel to stay up to date on breaking news coverage

