Join Our Telegram channel to stay up to date on breaking news coverage
Bitcoin (BTC) Price Prediction – March 26
BTC/USD is on track for having the first bullish day after several falls as the bulls take the price up from $51,320 to $54,096.
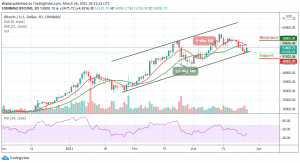
BTC/USD Long-term Trend: Bullish (Daily Chart)
Key levels:
Resistance Levels: $58,000, $60,000, $62,000
Support Levels: $48,000, $46,000, $44,000

BTC/USD is seen recovering above the previous support turned resistance of $54,000. Today, short-term price action has formed a wedge that has clearly broken to the upside. This has resulted in price levels attempting to continue the uptrend. Buying volume has yet to flood back into the market and will be required in order to sustain any form of a new uptrend.
Where is BTC Price Going Next?
Meanwhile, as long as the 9-day remains above the 21-day moving averages, traders can expect BTC to consolidate at higher levels. That’s if we could see a further climb above the $54,000 which is fast approaching; it may likely reach the resistances at $58,000, $60,000, and $62,000. Nevertheless, the critical support levels are located at $48,000, $46,000, and $44,000 respectively.
Currently, the Bitcoin price follows a dominant bullish bias. A glance at the technical indicator RSI (14) displays a positive picture of the coin in the near-term. Besides, maintaining a gradual upward slope above the 60-level, the technical indicator is increasing as a signal for growing buying entries.
BTC/USD Medium-Term Trend: Bearish (4H Chart)
Looking technically, BTC/USD needs to climb $55,000 above the upper boundary of the channel to mitigate the short-term bearish pressure and allow for an extended recovery towards $56,000. This psychological barrier may closely follow by $57,000 and $59,000 resistance levels.
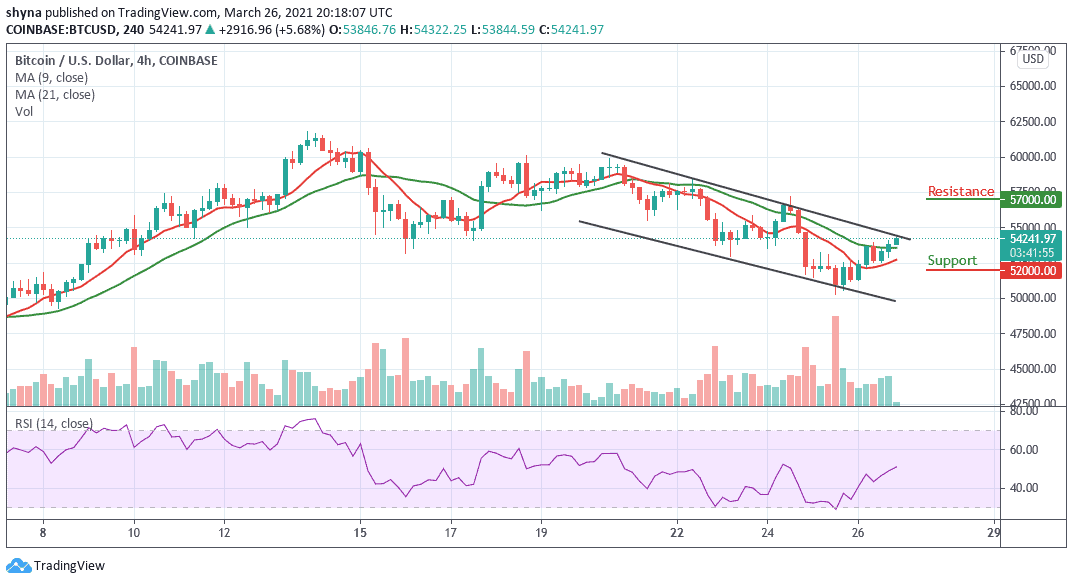
In contrast, the nearest support is at $53,000, and a sustainable move lower will increase the downside pressure and push the price towards $52,000 and $50,000 support levels. Considering that the RSI (14) on a 4-hour chart is moving to cross above the 50-level, traders might expect more bullish signals into the market.
Join Our Telegram channel to stay up to date on breaking news coverage