

Join Our Telegram channel to stay up to date on breaking news coverage
Bitcoin (BTC) Price Prediction – March 19
The price of Bitcoin rebounds above $58,000, despite the pressure from the sellers.
BTC/USD Long-term Trend: Bullish (Daily Chart)
Key levels:
Resistance Levels: $64,000, $66,000, $68,000
Support Levels: $50,000, $48,000, $46,000
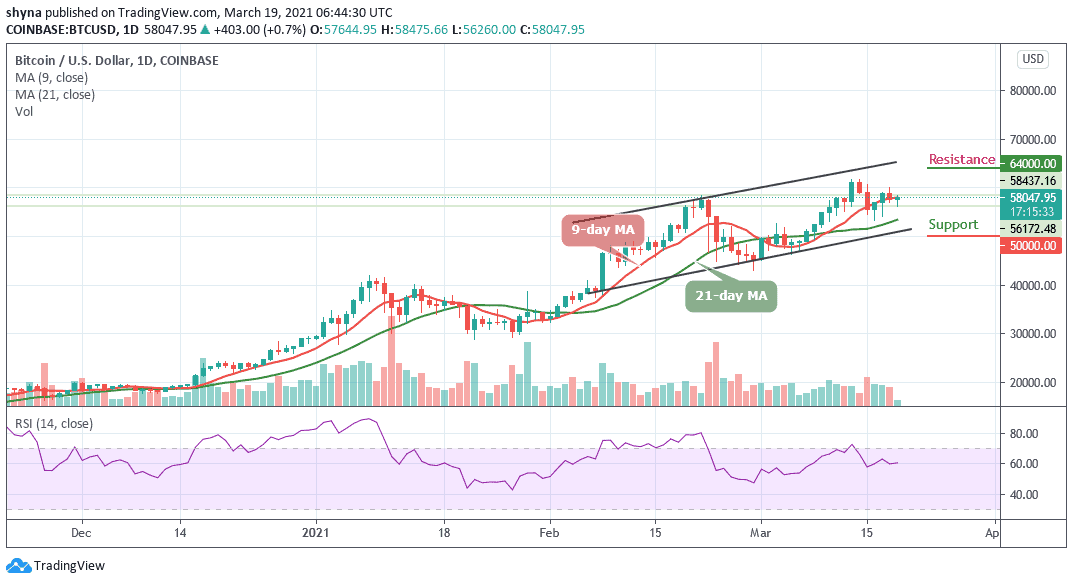
As reveals by the daily chart, BTC/USD is leading the pack after regaining ground above $58,000. The cryptocurrency market is on the rise again, after retracing in the last few hours. Yesterday, the rejection from levels close to $60,000 lost traction before closing at $57,644. The buyers are now taking the advantage of the support at the 9-day MA to force the on-going reversal.
What to Expect from BTC/USD
At the time of writing, BTC/USD is dancing slightly above $58,000 while bulls work extra hard to boost to the $60,000 resistance level. The cheerful optimism seems to have been validated by the technical indicator RSI (14), as it rebounds above the 60-level heading to the north. However, the first digital asset could trigger a massive bull run if it breaks the resistance at the newly achieved all-time high at 61,000. Moreover, trading above $62,000 may see the king of cryptocurrencies enter the price discovery mode.
Therefore, any further bullish movement above $62,000 could locate the potential resistance levels of $64,000, $66,000, and $68,000. On the other hand, a bearish narrative may come into the picture if Bitcoin closes the day under $55,000. Breaking below the lower boundary of the channel might trigger massive sell orders creating enough volume to force BTC into a downtrend while the critical supports may be located at $50,000, $48,000, and $46,000.
BTC/USD Medium-Term Trend: Ranging (4H Chart)
On the 4-hour chart, Bitcoin’s price is currently trading around $58,176 around the 9-day moving average after rebounding from the $57,452 low. Whereas, the 4-hour chart shows that the coin may likely experience a sideways movement as the signal line of RSI (14) is seen moving above the 55-level.
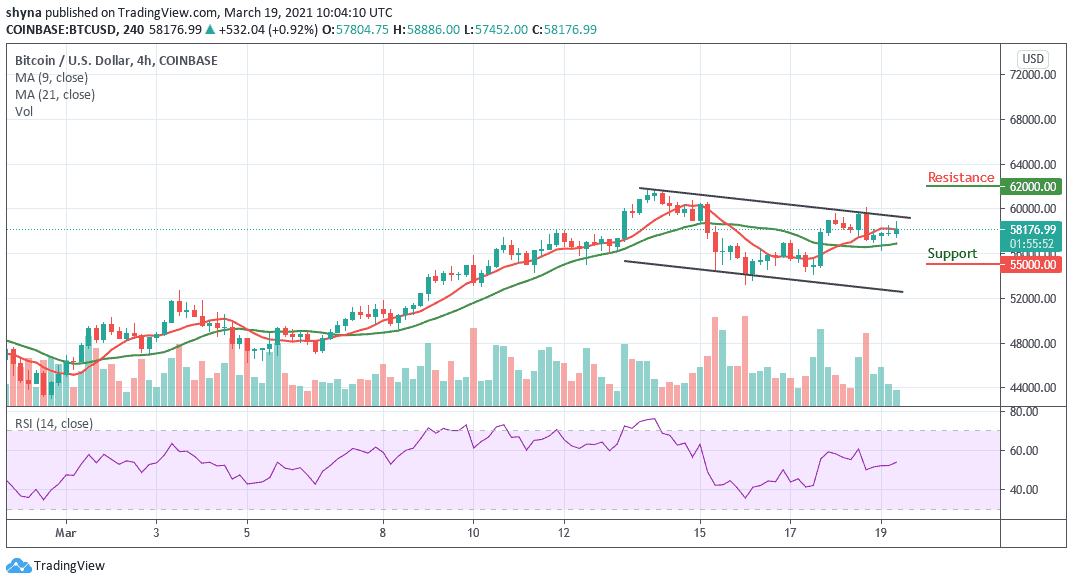
Therefore, if the market price moves below the 9-day and 21-day moving averages, keeping Bitcoin above $60,000 may be a daunting task. Meanwhile, the best support levels we may look at are $55,000, $53,000, and $51,000 while the potential resistance lies at $62,000 and above.
Join Our Telegram channel to stay up to date on breaking news coverage
