Join Our Telegram channel to stay up to date on breaking news coverage
Bitcoin (BTC) Price Prediction – February 28
Bitcoin price keeps on following the bearish movement after ramping through key support areas.
BTC/USD Long-term Trend: Bullish (Daily Chart)
Key levels:
Resistance Levels: $52,000, $54,000, $56,000
Support Levels: $38,000, $36,000, $34,000

BTC/USD bears have become quite unstoppable while the key support at $43,000 has been ravaged, forcing the bulls to concentrate on defending the next support which is targeted at $40,000. If this is broken, additional supports may be found at $38,000, $36,000, and $34,000.
What to Expect from Bitcoin (BTC)
The formation of a bullish flag pattern suggests the more upside action could resume only if the pattern’s support is not broken. However, a breakdown below the flags support may result in dire effects of Bitcoin price sliding towards $39,000. Meanwhile, the technical indicator has also supported the bearish motion, further drumming home the idea that this could be the end of the bull’s rally and could be an opportunity to buy or keep off.
However, the RSI (14) is serious with digging towards the 40-level while the sharp downward slope is a clear indication of the influence which allows the bears to put more pressure on the market. Meanwhile, a reversal is possible but only if the support at $48,000 is reclaimed. The persistence trade above this level may technically push the coin to the resistance levels of $52,000, $54,000, and $56,000.
BTC/USD Medium – Term Trend: Bearish (4H Chart)
Looking at the 4-Hour chart, Bitcoin (BTC) has not yet slipped below $40,000 and the coin is not yet in the loop of making a bounce back. BTC/USD price hovers below the 9-day and 21-day moving averages and may take time to persistently trade above the upper boundary of the channel. At the moment, the Bitcoin price is currently moving around $43,763 level.
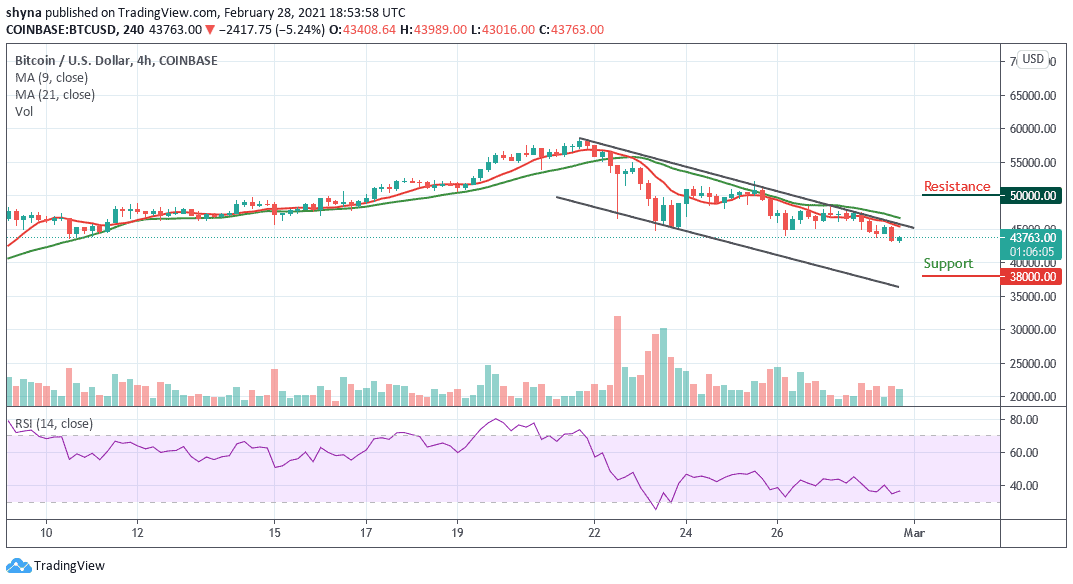
However, if the bulls re-group and energize the market, we may expect a retest of $45,000 level. Therefore, breaking the mentioned resistance could also allow the bulls to cross above the 9-day and 21-day moving averages to test the resistance levels of $50,000, $52,000, and $54,000. In other words, if bears should continue to hold the price and drag it downward, then the support levels of $38,000, $36,000, and $34,000 may be touched as the RSI (14) moves below 40-level, indicating more bearish signals.
Join Our Telegram channel to stay up to date on breaking news coverage