Join Our Telegram channel to stay up to date on breaking news coverage
Bitcoin (BTC) Price Prediction – September 17
At the time of writing, the first digital currency is seen flashing some mixed signs as the coin hovers beneath the $11,000 region.
BTC/USD Long-term Trend: Bullish (Daily Chart)
Key levels:
Resistance Levels: $11,600, $11,800, $12,000
Support Levels: $10,400, $10,200, $10,000
BTC/USD bulls are recovering after failing their first attempt to break above the resistance level of $11,000. However, despite a promising rally over $10,900, the surging momentum could not be enough to overcome the strong selling pressure at the critical psychological level as the coin keeps trading above the 9-day and 21-day moving averages.

Where is BTC Price Going Next?
BTC/USD is currently hovering at $10,963 and it is important to note that the impasse reached between bulls and bears also comes amidst weakness in the traditional markets, which may spill over into crypto and create a headwind that could make it difficult for the Bitcoin to surge higher. After weeks of trading inside the $10,000 range, Bitcoin once again touches the daily high at $11,044, making it the second time that the coin would be breaking the $11k hurdles since the beginning of this month.
Meanwhile, retracing below $11,000 at the moment means that BTC/USD may still need to overcome it decisively if it’s to continue the recent run and head towards the next resistance lines at $11,600, $11,800, and $12,000. Alternatively, if the current rejection sends the Bitcoin price further south, the critical support levels lie at $10,400, followed by $10,200, and $10,000 respectively. The RSI (14) is seen roaming around 50-level, suggesting a sideways movement.
BTC/USD Medium-Term Trend: Bullish (4H Chart)
Looking at the 4-hour chart, Bitcoin’s price is currently trading around $10,945, trading above the 9-day and 21-day moving averages after a reversal from the low of $10,735 that occurred some hours ago. Meanwhile, we can see that the bullish supply is coming up slowly in the market while the bears are also making an attempt to bring the price down.
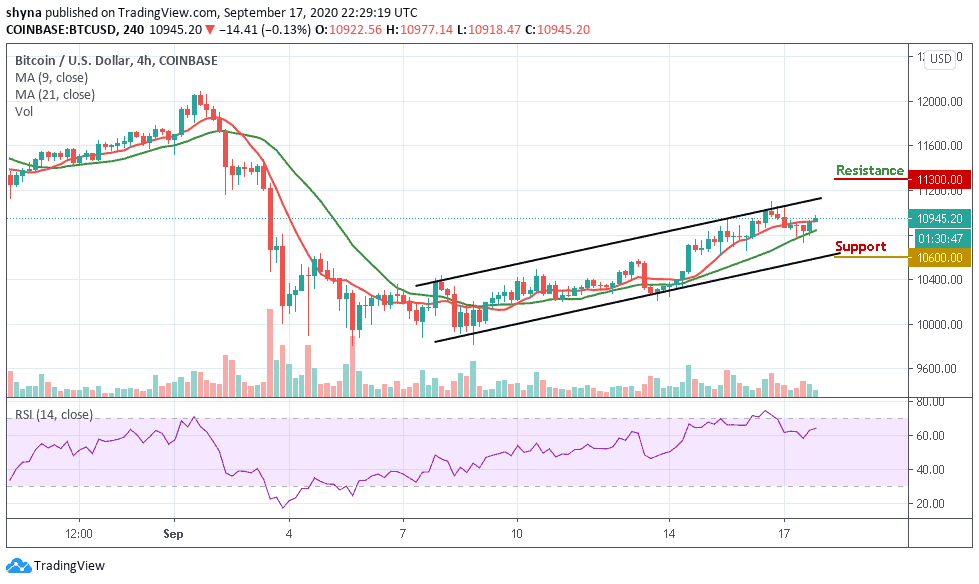
According to the 4-hour chart, if the buyers could hold the current market value tight, they can further push the price above the upper boundary of the channel to test the resistance level of $11,300 and above. In other words, the RSI (14) is currently moving around 65-level, but when it turns down; the bears could step back into the market to bring the coin down to the support of $10,600 and below.
Join Our Telegram channel to stay up to date on breaking news coverage