Join Our Telegram channel to stay up to date on breaking news coverage
Bitcoin (BTC) Price Prediction – February 19
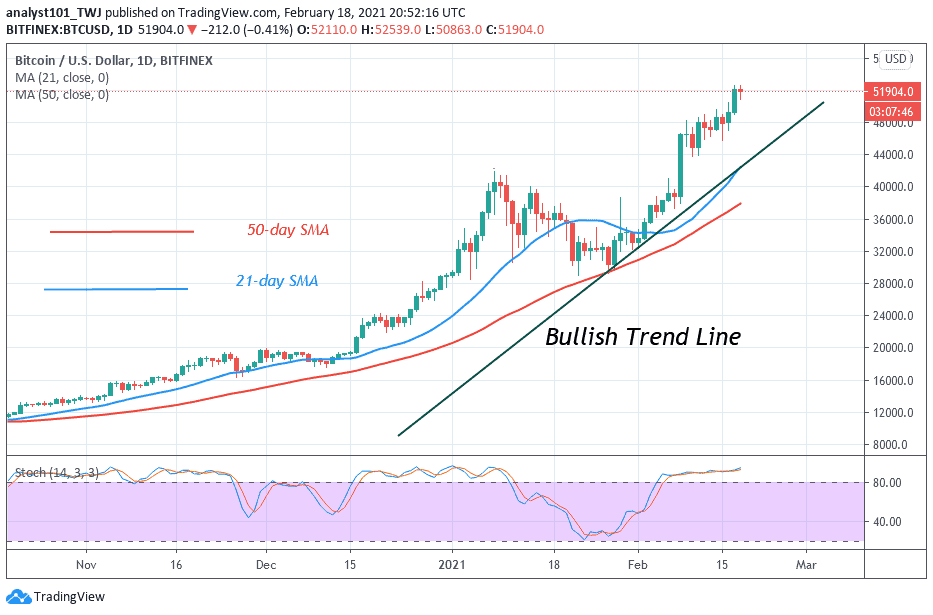
After a minor downside correction, Bitcoin price begins a fresh increase above the $52,000 level as its price is seen surging close to 2%.
BTC/USD Long-term Trend: Bullish (Daily Chart)
Key levels:
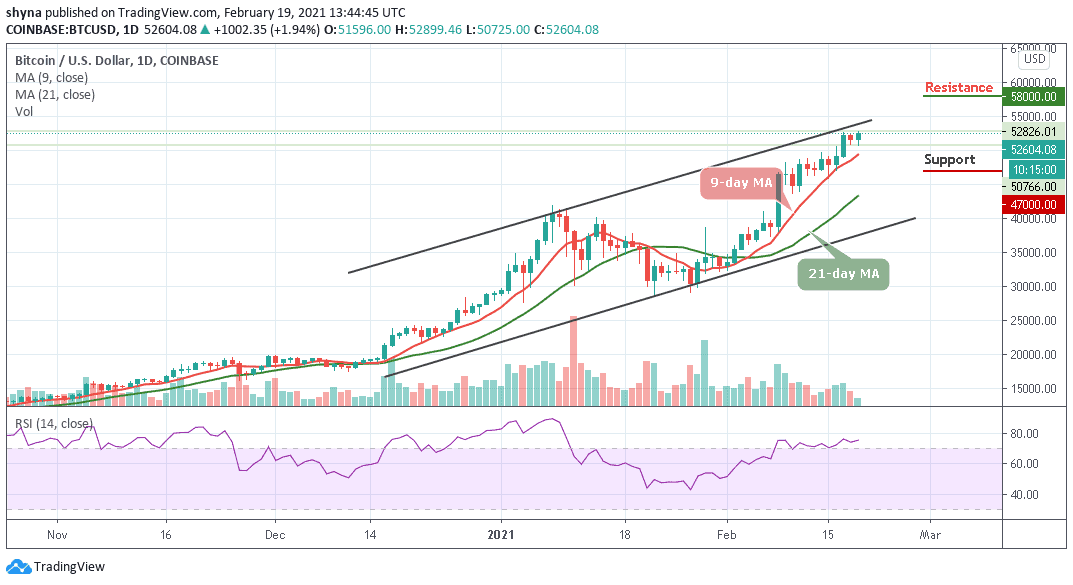
Resistance Levels: $58,000, $60,000, $62,000
Support Levels: $47,000, $45,000, $43,000
BTC/USD is on its way up and as it is now, it seems that there is nothing that can hold it back from reaching the higher level. However, the coin is currently trading at $52,604 after touching the new high of $52,899. The Bitcoin price spiked above $52,500 again and erased yesterday’s losses as the market remains above the 9-day and 21-day moving averages.
Will BTC Remain Above $52,500 Resistance or Reverse?
According to the daily chart, the Bitcoin bulls are now trading comfortably around the upper boundary of the channel as the price establishes a new bullish signal. However, the long-term outlook now favors the bulls, given the daily close produced a large bullish candle with eyes now set on the daily resistances at $58,000, $60,000, and $62,000 respectively.
However, rejection at $52,500 could eventually lead to declines to the critical support below the 9-day moving average at $49,000. In case BTC drops below this support level, then the coin can rely on the long-term support levels at $47,000, $45,000, and $43,000. Alternatively, the technical indicator RSI (14) is seen moving within the overbought region, suggesting a sideways movement.
BTC/USD Medium-term Trend: Bullish (4H Chart)
According to the 4-hour chart, the Bitcoin price is seen touching the daily high at $52,947. However, today’s price move happens to be one of the most impressive moves as it climbs slightly towards the resistance level of $53,000. More so, BTC/USD is now maintaining its bull-run above $52,500 as the RSI (14) moves around 68-level.
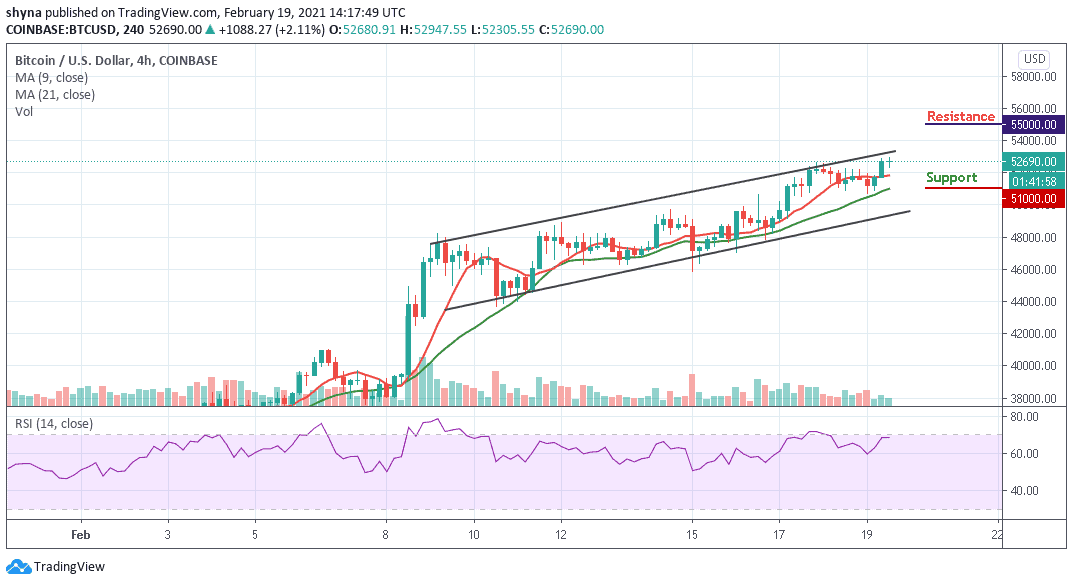
However, the Bitcoin price may take a downward move if the bulls failed to push the price higher again. Therefore, the coin may breach the major support near $52,000 and could reach the main support at $51,000 and below. Nevertheless, if the bulls find a decent resistance level of around $53,000, the coin may continue its recovery by crossing above the channel to hit the resistance at $55,000 and above.
Join Our Telegram channel to stay up to date on breaking news coverage