Join Our Telegram channel to stay up to date on breaking news coverage
Bitcoin (BTC) Price Prediction – February 17
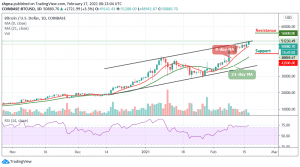
According to the daily chart, the price of Bitcoin continues to climb higher but one key support level must hold for the rally to continue.
BTC/USD Long-term Trend: Bullish (Daily Chart)
Key levels:
Resistance Levels: $56,000, $58,000, $60,000
Support Levels: $43,500, $41,500, $39,500

As the daily chart reveals, BTC/USD bull-run seems to be unstoppable right now as the coin has just notched another new high at $51,288. However, the Bitcoin price has been grinding up in the past few weeks, establishing some potential areas of support in the event of a pullback. Currently, the technical indicator RSI (14) is swimming within the overbought conditions, strengthening the bullish market.
Where is BTC Price Going Next?
The daily chart above shows that this bullish continuation is seen as a result of BTC rallying towards the next point of interest. Therefore, this area is found around the resistance level of $50,000 and the key level is also an important psychological barrier for the coin. Presently, the BTC/USD has successfully cleared the $50,000 and it is currently climbing higher.
Nevertheless, the critical level to watch is between $47,000 – 45,000 but as long as this area sustains support, the Bitcoin price may continue to run towards the resistance levels of $55,000, 58,000, and $60,000. Moreover, if the market makes a quick turn to the south, the price may likely drop below $48,000, and should this support fails to contain the sell-off, traders may see a further roll back to $43,500, $41,500, and critically $39,500.
BTC/USD Medium – Term Trend: Bullish (4H Chart)
Bitcoin price surges upward within 24 hours, catapulting its price over $50,000 to reach where it currently trades at around $51,146. This sudden rise also pushed the price overall other altcoins, which increased by more than 6% in the respective period. However, the closest resistance levels lie at $55,000 and above, while the nearest supports are $49,000 and below.
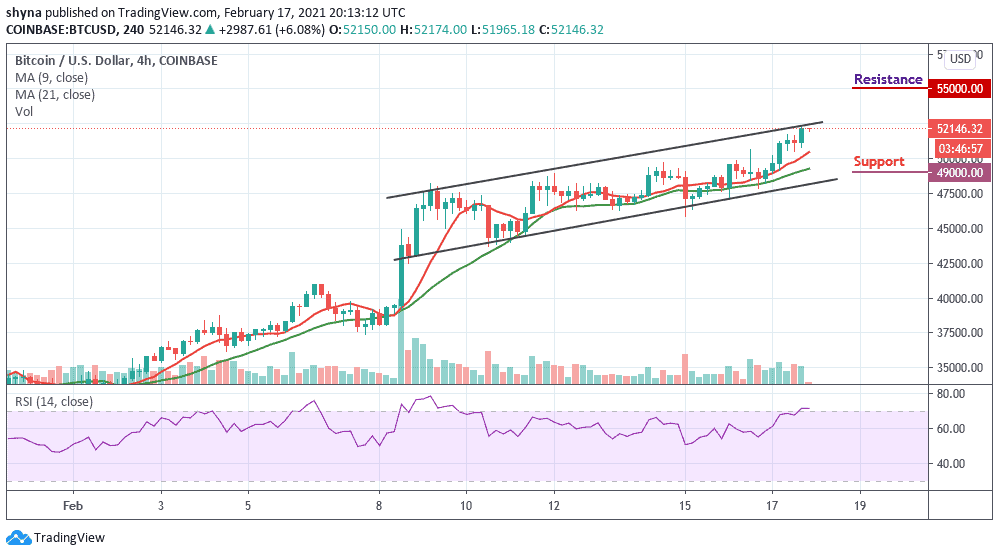
Moreover, as the coin moves above the 9-day and 21-day moving averages, the technical indicator is looking bullish and still flashing buy signals. The technical indicator RSI (14) indicator is moving above the 70-level, suggesting more bullish trends at the moment.
Join Our Telegram channel to stay up to date on breaking news coverage