Join Our Telegram channel to stay up to date on breaking news coverage
Bitcoin (BTC) Price Prediction – February 11
The Bitcoin price set fresh all-time highs today, with bulls taking full control of the market as they set their sights on $50,000.
BTC/USD Long-term Trend: Bullish (Daily Chart)
Key levels:
Resistance Levels: $53,000, $55,000, $57,400
Support Levels: $40,000, $38,000, $36,000
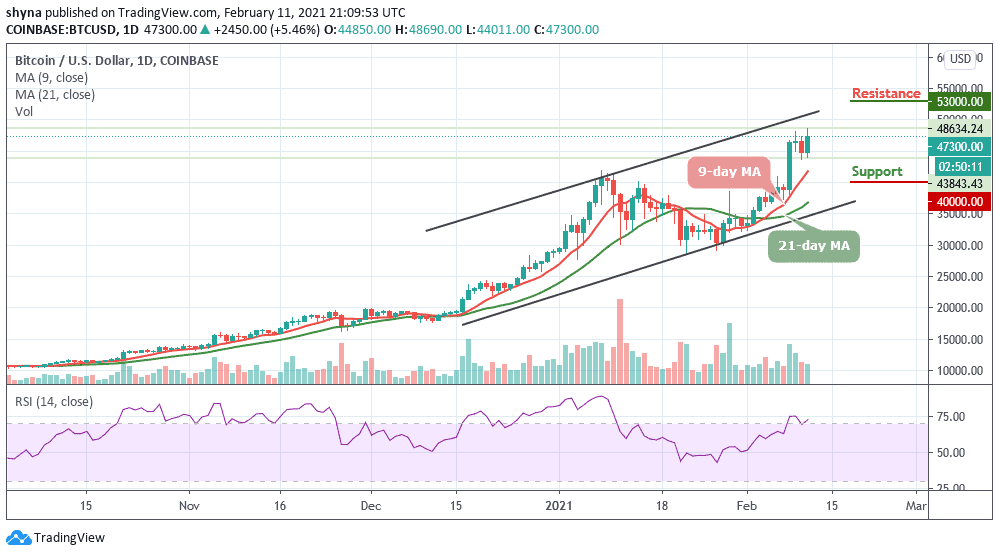
BTC/USD have been caught within a strong uptrend throughout the past few days and weeks, with sellers unable to gain any profound control over the aggregated market. However, there have been a few intense selloffs, but positive catalysts seem to be lying in wait around every corner to help fuel the uptrend. At the time of writing, BTC/USD is trading up just under 5.46% at its current price of $47,300 after it touches the daily high of $48,690.
Where is BTC Price Going Next?
The Bitcoin price remains firm above the 9-day and 21-day moving averages as each dip is being aggressively absorbed, which is a positive sign that indicates that bulls are maintaining control over the market. Therefore as long as the market maintains its strength, the first digital asset could be well-positioned to see some massive upside which may cause the coin to hit the potential resistance at $53,000, $55,000, and $57,000.
However, rejection at $48,500 could eventually lead to declines to the critical support below the 9-day moving average at $41,000. In case BTC drops more, then the coin can rely on the long-term support levels at $40,000, $38,000, and $36,000. Looking at the daily chart, the technical indicator RSI (14) signal line is now moving within the overbought region, suggesting more bullish signals.
BTC/USD Medium-term Trend: Bullish (4H Chart)
According to the 4-hour chart, the Bitcoin price touches the daily high at $48,690. However, today’s price move happens to be the most impressive one as it climbs above the long-awaited resistance level of $48,000 with a sharp upsurge. More so, BTC/USD is now maintaining its bull-run above $49,000.
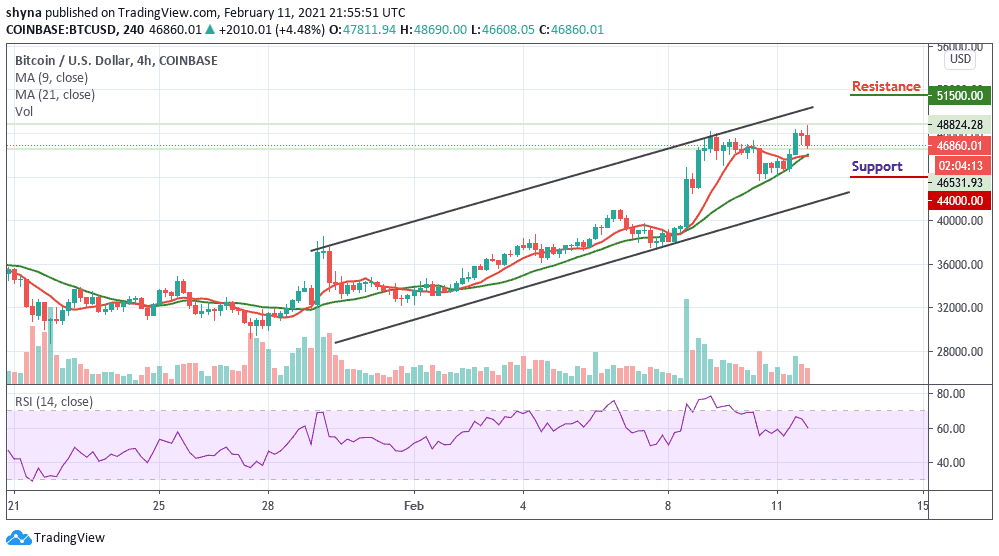
However, as the RSI (14) nosedives below 65-level, BTC may take a downward move. Therefore, the coin may breach below the 9-day and 21-day moving averages and could reach another support at $44,000 and below. Nevertheless, if the bulls find a decent resistance level of around $50,000, the coin may continue bullish movement above the channel at the resistance level of $51,500 and above.
Join Our Telegram channel to stay up to date on breaking news coverage