Join Our Telegram channel to stay up to date on breaking news coverage
Bitcoin (BTC) Price Prediction – February 6
Bitcoin bulls are working hard to nurture a bullish trend above the resistance level of $41,000.
BTC/USD Long-term Trend: Bullish (Daily Chart)
Key levels:
Resistance Levels: $45,000, $47,000, $49,000
Support Levels: $34,000, $32,000, $30,000
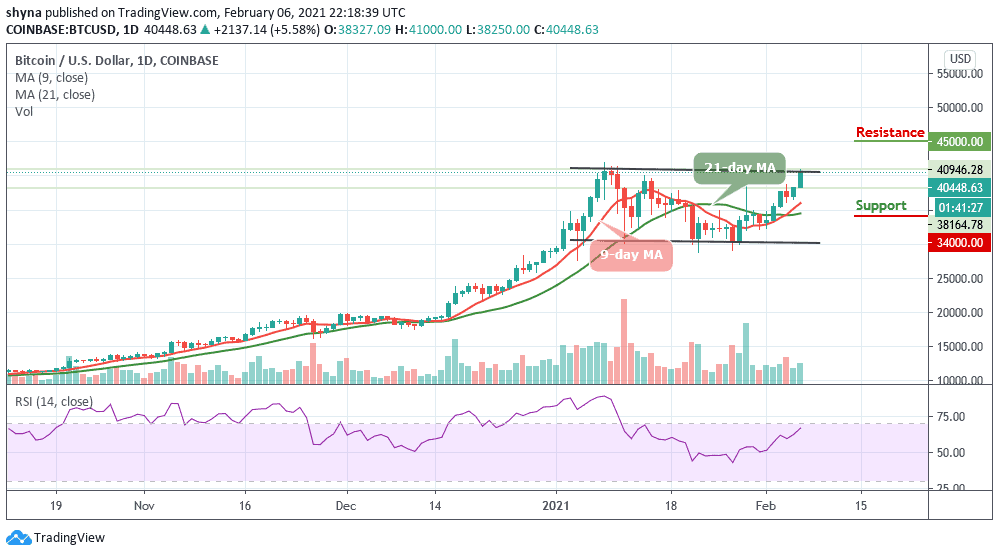
BTC/USD is currently trading 5.58% higher on the day after the coin opened the session at $38,327 and now adjusting upwards to the prevailing market value of $40,000. The first digital coin is moving within the short-term bullish trend amid low volatility. The current conditions imply that the price may stay range-bound during the next trading hours as the coin moves above 9-day and 21-day moving averages.
What to Expect from Bitcoin (BTC)
At the opening of the market today, after testing the low of $38,250, BTC/USD is currently trading at $40,448. Meanwhile, looking at the market movement, there is likely that the market may experience a quick retracement or sell-off just after touching the crucial $41,000, and traders may see $39,000 to $38,000 being tested again before pushing higher.
On the downside, if the market decides to fall, the price of Bitcoin could fall below the moving averages at $35,000, and if that support fails to hold the sell-off, traders could see a further decline towards the support levels of $34,000, $32,000, and critically $30,000. All the same, any further bullish movement above the upper boundary of the channel may hit the resistance levels of $45,000, $47,000, and $49,000 as the technical indicator RSI (14) moves to cross into the overbought region.
BTC/USD Medium – Term Trend: Bullish (4H Chart)
On the 4-hour chart, we expect the coin to gain the lost momentum and hit the trade above $41,000. However, the volatility hovers, and the selling pressure still exists as the coin stays above the moving averages. Meanwhile, the $38,000 and below may come into play if BTC breaks below moving averages.
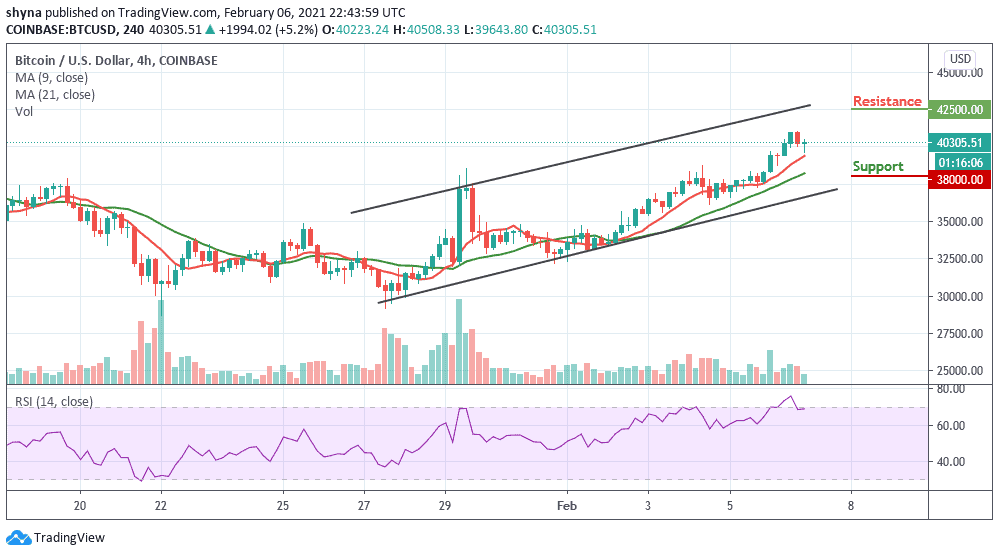
However, in as much as the buyers can still reinforce and power the market, traders can expect a retest at a $41,000 resistance level, and breaking this level may further allow the bulls to reach $42,500 and above. The RSI (14) is seen trading below the 70-level which shows that the coin may retreat.
Join Our Telegram channel to stay up to date on breaking news coverage