Join Our Telegram channel to stay up to date on breaking news coverage
Bitcoin (BTC) Price Prediction – February 3
Bitcoin price rises for the third straight bullish day as the technical indicator on the daily chart continues to move above the 55-level.
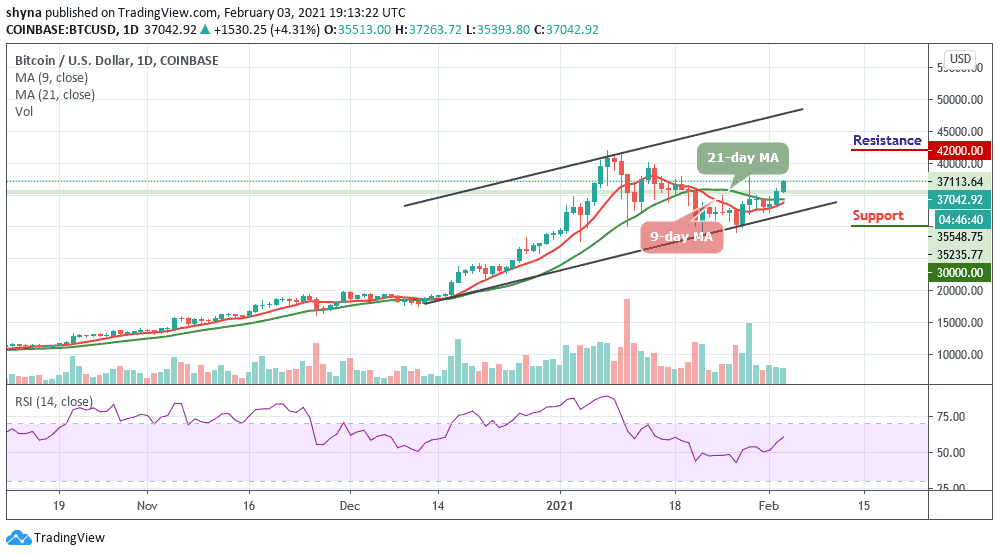
BTC/USD Long-term Trend: Bullish (Daily Chart)
Key levels:
Resistance Levels: $42,000, $44,000, $46,000
Support Levels: $30,000, $28,000, $26,000
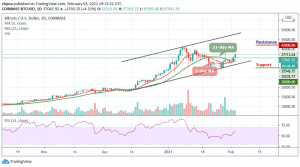
BTC/USD price is currently hovering above the potential resistance level of $37,000 as the coin keeps moving higher to trade at $37,042 at the time of writing. The first digital asset is moving with strong bullish momentum after a sustainable break above an important technical level.
Where is BTC Price Going Next?
Looking at the daily chart, the technical indicator RSI (14) is floating above the 50-level for the 3rd straight day. Additionally, the price seems not to have reached the upper limit of the linear regression channel coming from below the moving averages, suggesting that BTC/USD could retreat toward $33,000, before attempting to break higher.
Nevertheless, the 9-day and 21-day moving averages continue to edge higher, showing no significant bearish pressure for the time being. On the upside, $40,000 aligns as the initial resistance. A daily close above that level could lift the price to $42,000, $44,000, and $46,000. On the other hand, Bitcoin could retreat below the moving averages. More so, if it breaks below the lower boundary of the channel, the critical supports are located at $30,000, $28,000, and $26,000 respectively.
BTC/USD Medium – Term Trend: Bullish (4H Chart)
According to the 4-hour chart, BTC/USD is currently in the ascending range of the medium-term outlook as the target market is keeping the support levels of $35,000, $33,000, and $31,000. But the Bitcoin market is gaining momentum with the support of a 9-day moving average as the buyers keep the position intact.
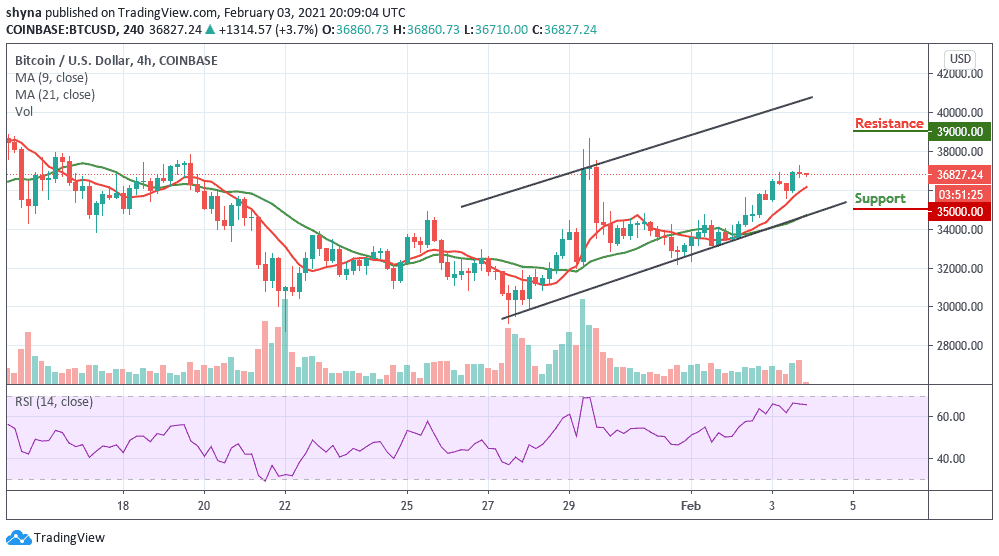
Looking at the RSI (14) indicator, it shows that BTC price may begin to move sideways before a rebound could take place. Immediately after the market rebounds, the buyers may hit the $39,000, $41,000, and $43,000 resistance levels.
Join Our Telegram channel to stay up to date on breaking news coverage