Join Our Telegram channel to stay up to date on breaking news coverage
Bitcoin (BTC) Price Prediction – January 19
Bitcoin (BTC) has effortlessly zoomed above the moving averages but the upside is limited.
BTC/USD Long-term Trend: Bullish (Daily Chart)
Key levels:
Resistance Levels: $42,000, $44,000, $46,000
Support Levels: $32,500, $30,500, $28,500
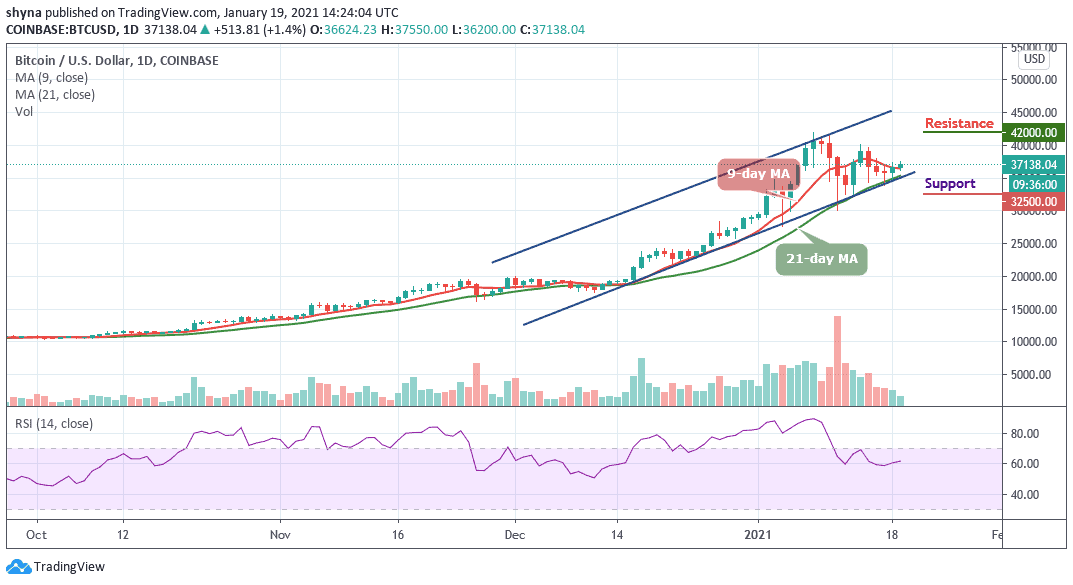
BTC/USD is currently following the bullish trend in the long-term outlook as the bears are losing the momentum and could not penetrate below the channel. The coin is now bouncing towards the north as it hovers above the 9-day and 21-day moving averages where it is trading currently at $37,138.
What to Expect from Bitcoin (BTC)
Bitcoin may likely have a bullish trend in the near term, but a price rally could help it hit its monthly high again. Currently, Bitcoin is trading around $37,138 level after touching the daily low at $36,200. More so, the coin is now facing the resistance level of $38,000 waiting to touch the $40k resistance again. The bullish daily candle forming today on the daily chart indicates that the bulls may be fully in control in the nearest term.
Meanwhile, looking at the chart, $33,000 serves as the major support level, making room for BTC to fall further. Any further bearish movement could lead to the supports of $32,500, $30,500, and $28,500 respectively. Nevertheless, the RSI (14) is heading above 60-level to indicate an upward movement. More so, BTC/USD may likely see the resistance levels of $42,000, $44,000, and $46,000 respectively.
BTC/USD Medium – Term Trend: Bullish (4H Chart)
Before a serious drop that surfaced today, the Bitcoin price surged upwards of over $500 in today’s trading, catapulting its price from $36,624 to reach around $37,550. After the sudden rise, the coin started dropping in price to where it’s trading currently at $36,402. Should the price continue to drop further, it could reach the nearest supports at $35,000 and below.
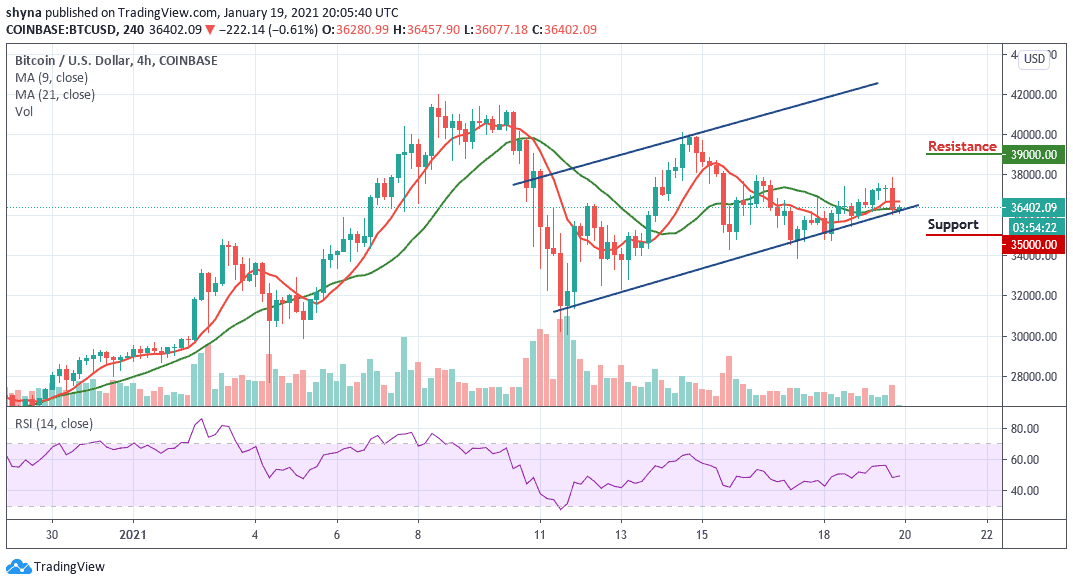
Moreover, if the bulls could put a little effort to push the price above the moving averages, the price of Bitcoin may likely hit the resistance at $38,000 before heading to the potential resistance levels of $39,000 and below. Meanwhile, the RSI (14) moves below 50-level, which shows more bearish momentum.
Join Our Telegram channel to stay up to date on breaking news coverage