Join Our Telegram channel to stay up to date on breaking news coverage
Bitcoin Price Analysis (BTC) – January 18
The Bitcoin price is holding in the $36,000 level and it may likely surge into the $38,000 level before plunging again.
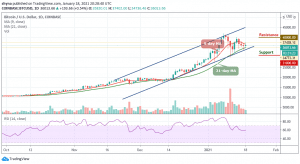
BTC/USD Long-term Trend: Bullish (Daily Chart)
Key levels:
Resistance Levels: $40,000, $42,000, $44,000
Support Levels: $31,000, $29,000, $27,000

BTC/USD market keeps trading at the upside as the price stays within the 9-day and 21-day moving averages. In the early hours of today, bulls break above the $37,000 resistance level and then pulled back as the price remains within the moving averages. Moreover, as long as the technical indicator RSI (14) remains above the 60-level, there is likely to be a downward correction that may come to play as soon as the signal begins to move below this level.
What to Expect from Bitcoin (BTC)
BTC/USD may likely pullback and retraces to the support level of $35,000. This could increase the chances of a rally above $40,500. In addition, if the price pulls back below the 21-day moving average, this is an indication that Bitcoin (BTC) is getting weaker. Meanwhile, the technical indicator RSI (14) is currently at around 60-level, which indicates that the market is on the upside.
Expectantly, to sustain the upward movement, the bulls will have to break out towards the channel at a $39,300 resistance level. Further bullish movement may reach the potential resistance levels at $40,000, $42,000, and $44,000 respectively. While $31,000, $29,000, and $27,000 will serve as the major support levels, making room for the Bitcoin price to fall even further.
BTC/USD Medium-term Trend: Ranging (4H Chart)
BTC/USD trades within the range of $33,800 to $37,500. Nevertheless, Bitcoin has not yet slipped below $35,000 and is still in the loop of making a bounce back. BTC price hovers around $36,058 and may take time to persistently trade above $37,000. The upward movement is facing hurdles near the $39,000 and $40,000 resistance levels.
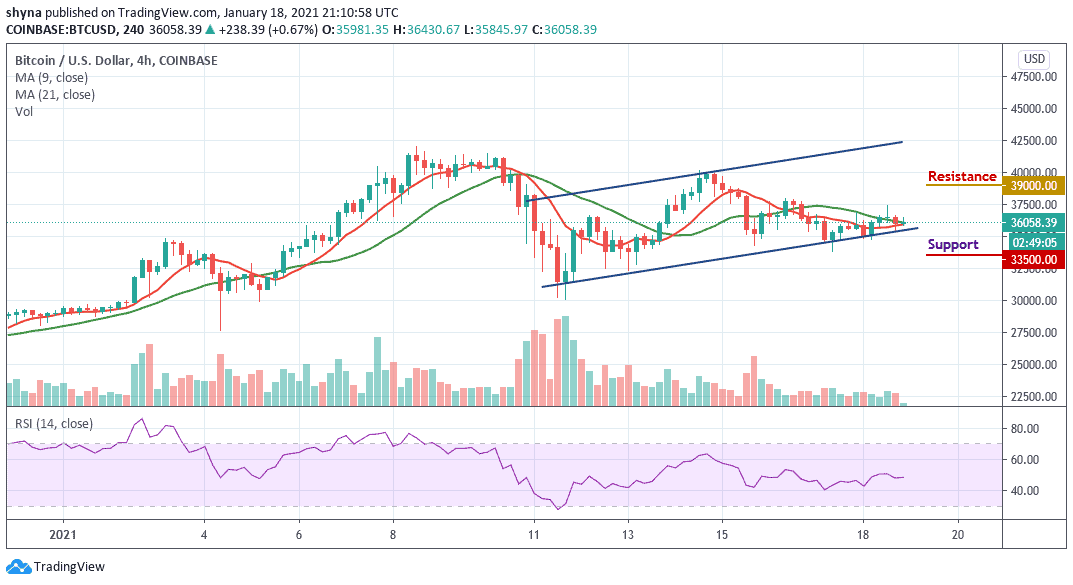
On the downside, immediate support is below the lower boundary of the channel as the main support is at the $34,000 level. The price might slide sharply below $33,500 which may likely test the main support at the $32,500 level. Technically, Bitcoin is poised for more losses in the near-term as the RSI (14) is currently below the 50-level, indicating a sideways movement.
Join Our Telegram channel to stay up to date on breaking news coverage