Join Our Telegram channel to stay up to date on breaking news coverage
Bitcoin (BTC) Price Prediction – January 12
BTC/USD is struggling to recover above $36,000 but the coin remains at a risk of a larger breakdown below the $30,000 support.
BTC/USD Long-term Trend: Bullish (Daily Chart)
Key levels:
Resistance Levels: $40,000, $42,000, $44,000
Support Levels: $28,000, $26,000, $24,000
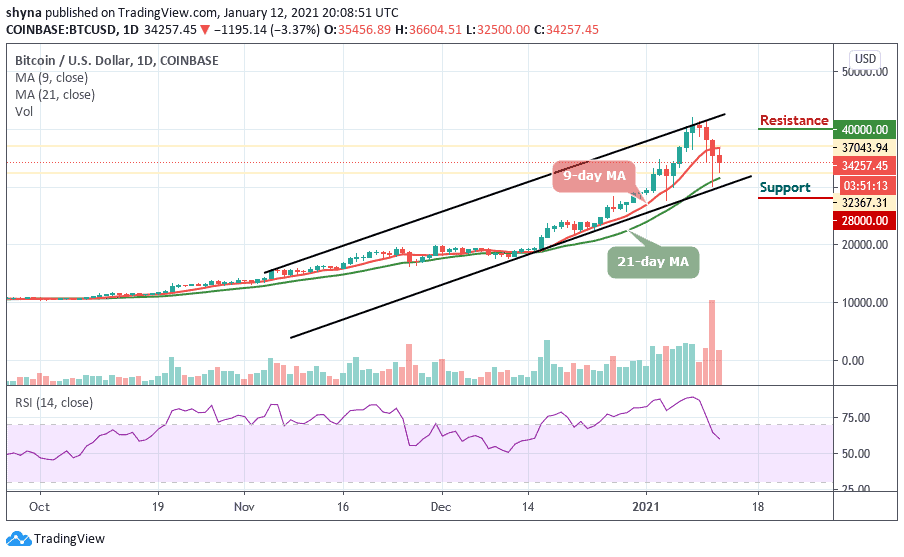
BTC/USD has been struggling to maintain its position above $36,000 and its price sees another dive below the $33,000 level today. The coin could be in a dangerous position if the price slips below the 21-day moving averages. However, if the breakthrough is confirmed, the downside momentum may gain traction with the next focus on $30,000. At the time of writing, Bitcoin is trading below the 9-day moving average at $34,257 with a decline of 3.37% on the daily price chart.
Where is BTC Price Going Next?
The prevailing trend is bearish with expanding volatility. The king coin currently consolidates within the ascending channel. A break below this pattern may continue in the direction of the previous trend. Meanwhile, BTC/USD may cross below the lower boundary of the channel.
However, in as much as the bulls could not move the coin to the north; traders may see a price cut to $30,000 vital support. A further low drive could send the price to $28,000, $26,000, and $24,000 support levels while the resistance levels are located at $40,000, $42,000, and $44,000. The RSI (14) indicator suggested a more bearish crossover in the near future.
BTC/USD Medium – Term Trend: Ranging (4H Chart)
Bitcoin (BTC) has demolished all expectations of a price recovery anytime soon by falling below the 9-day moving average. After touching the low of $32,500, the price is currently trading around the $34,095 level. Meanwhile, with the latest downward price swings, the coin could not show any significant signs of growth over the last 24 hours. On the upside, the next level of resistance is located at $39,000 and above.
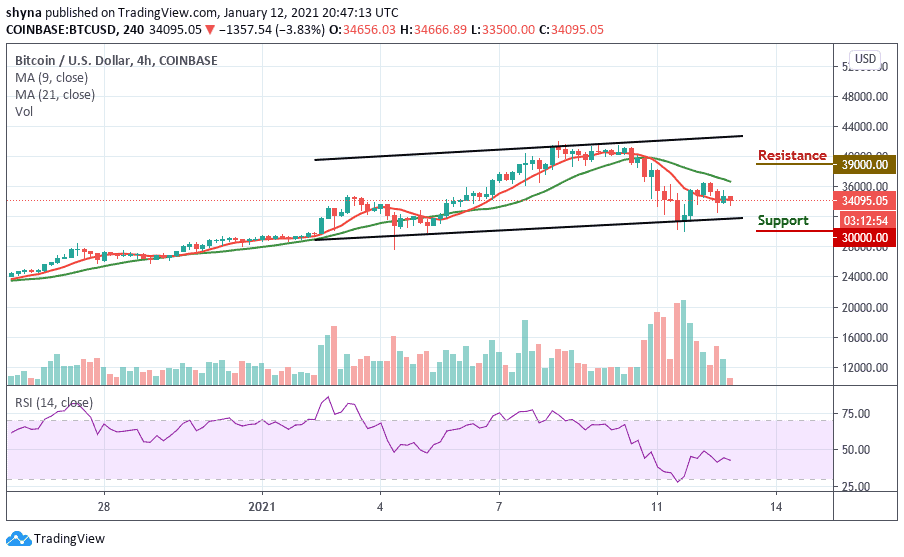
However, the price of Bitcoin couldn’t fight the resistance as it continues the downward movement. Overwhelming selling pressure pushed Bitcoin off-balance as it plunged under $34,000. A significant drop below this support may cause new drops at $30,000 and below. The RSI (14) is seen moving below the 45-level.
Join Our Telegram channel to stay up to date on breaking news coverage