Join Our Telegram channel to stay up to date on breaking news coverage
Bitcoin (BTC) Price Prediction – August 19
Bitcoin (BTC) free-falls below $12,000, the coin is unlikely to hold onto the short support at $11,700.
BTC/USD Long-term Trend: Bullish (Daily Chart)
Key levels:
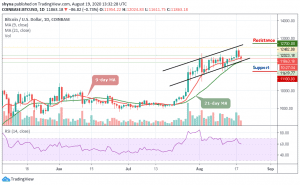
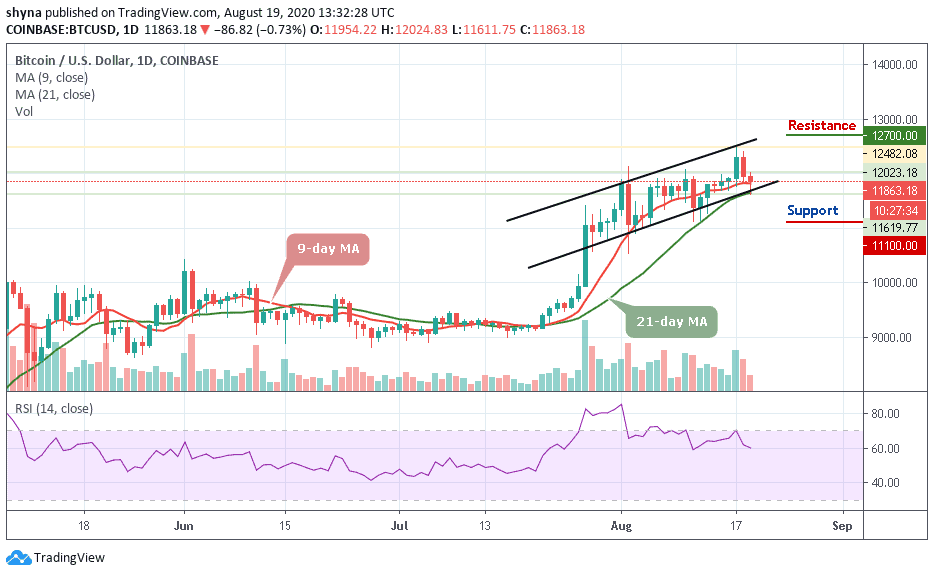
Resistance Levels: $12,700, $12,900, $13,100
Support Levels: $11,100, $10,900, $10,700
BTC/USD is seen pulling the entire market down with it following losses under $12,000. However, the failure to hold above the $12,000 must-have encouraged more sellers to join the market and push for revenge. At the time of writing, Bitcoin is trading at $11,863. It has lost 0.73% of its value on the day considering the number-one crypto commenced the session at $11,968. The prevailing trend is strongly bearish, however, with shrinking volatility and it is likely to hold onto the short term support at $11,700.
What to Expect from Bitcoin (BTC)
Looking at the daily chart, the dominant trend is bearish and this highlighted by the technical indicator RSI (14) which may cross below 60-level. Similarly, the 9-day MA is seen moving lower which may cross below 21-day MA. However, sellers have the say at the moment and the most probable direction for Bitcoin (BTC) is downward unless support at $11,700 stays intact and buyers keep their eyes back on $12,000.
Moreover, if the bulls push higher, the first level of resistance is located at $12,200. A sustainable move above $12,200 is needed for the upside to gain traction while the next important resistance may come at $12,500. Further resistance levels could be located around $12,700, $12,900, and $13,100 while the critical supports lie at $11,100, $10,900, and $10,700.
BTC/USD Medium-Term Trend: Bullish (4H Chart)
Looking at the 4-hour chart, the bears are seen coming back into the market as the 9-day MA crosses below the 21-day MA. The break below this crucial barrier caused it to plunge as low as $11,614, with bulls stepping up and guarding against a decline beneath this level. Meanwhile, unless it recaptures $12,000 in the near-term, the bears could have the upper hand over the bulls, and BTC/USD may soon reel significantly lower.
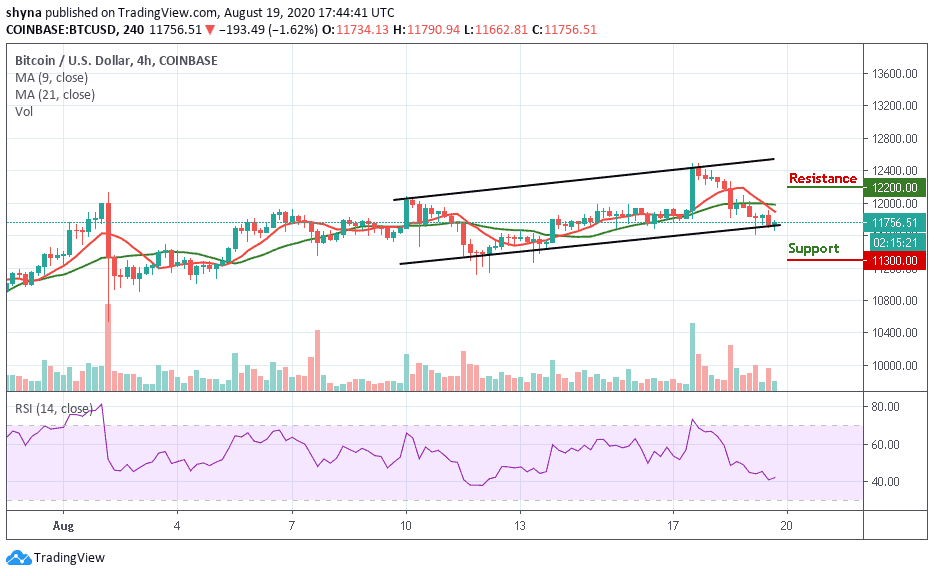
However, any further bearish movements could see the support levels of $11,300 and below. Meanwhile, as the technical indicator RSI (14) moves above 40-level, bullish signals may likely surface to push the price above the moving averages. The resistance levels to watch for are $12,200 and above.
Join Our Telegram channel to stay up to date on breaking news coverage